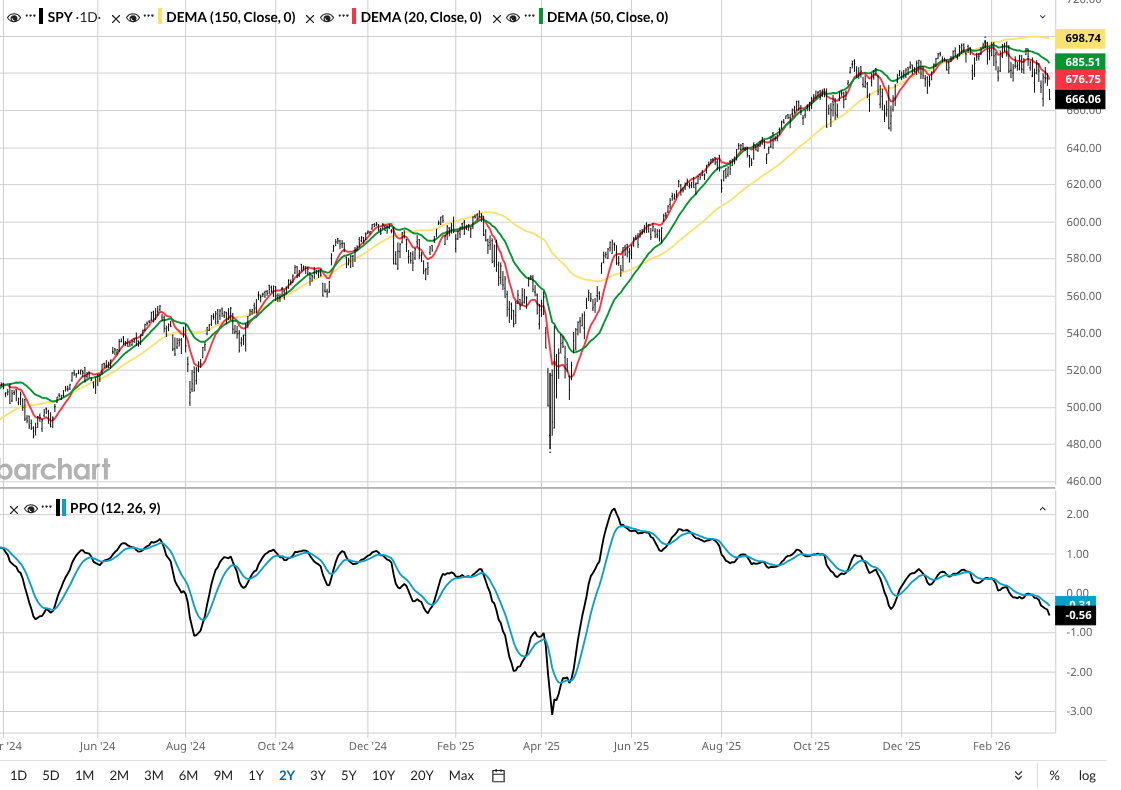
The stock market is walking a tightrope. And every day, it looks more like it's falling off. Let’s start with this daily chart. The 20-day moving average I’ve highlighted here many times this year is not just rolling over — it is starting to decelerate. And barring a save around the $630 area, the SPDR S&P 500 ETF Trust (SPY) could go much further south.
Still, since I always look at both sides of the story, I want to show the weekly chart below. Frankly, it looks worse in this more intermediate-term time frame. The question seems to be not whether it will get weaker in the coming weeks and months, but if it will recover quickly. That was the case in 2020, 2022, and 2025. But this time is different.
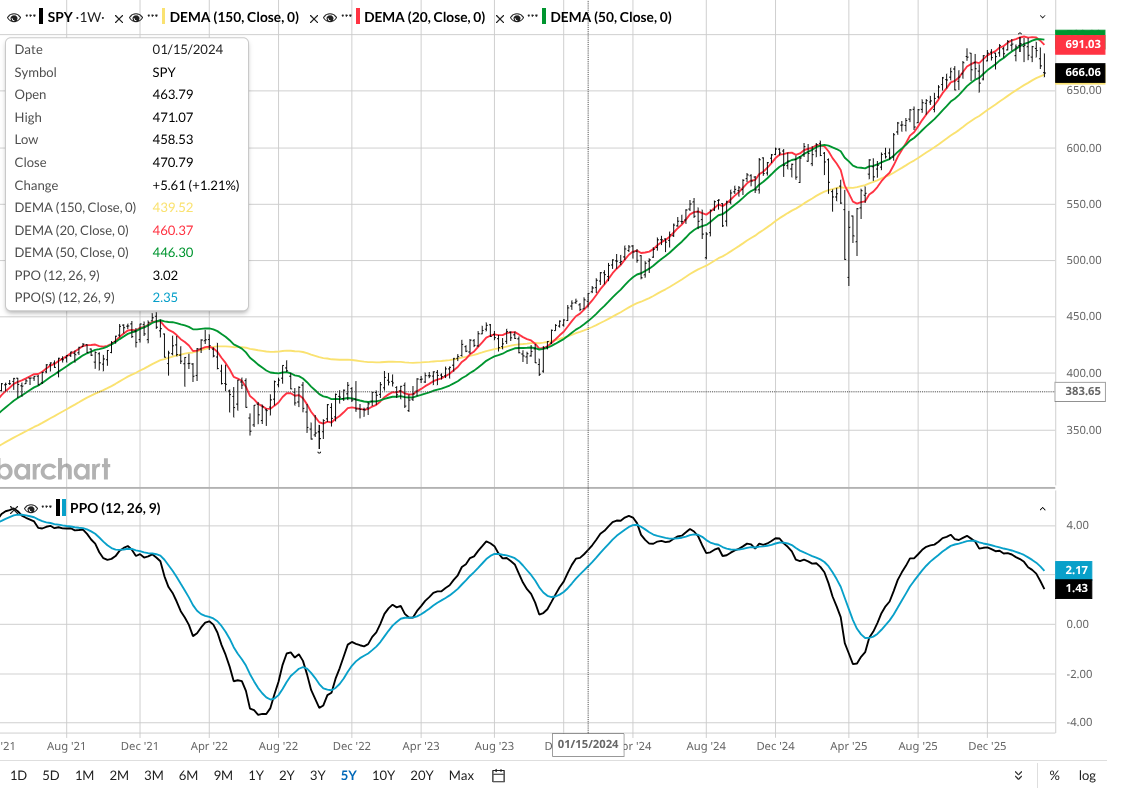
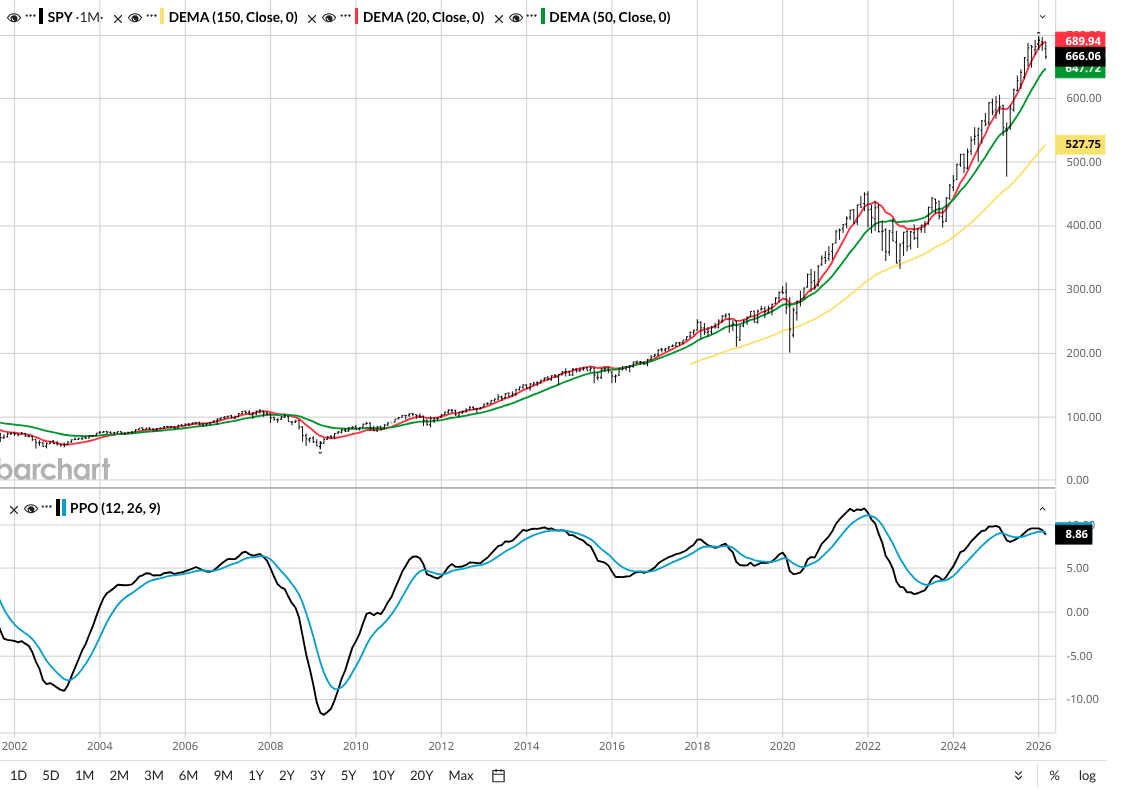
Even the weekly chart offers no solace for bulls. The 20-month moving average and PPO indicator both look very much like they did prior to their rapid descent around this time last year. And clearly, in terms of technical and fundamental valuation, the best description is “elevated.”
What’s the Bear Case for the S&P 500?
There is mounting evidence to suggest that we are experiencing a fundamental breakdown in the three pillars that supported the 2025 rally: cheap energy, a resilient consumer, and the unquestioned dominance of the “Magnificent 7” stocks.
The most glaring threat is the sudden return of stagflation fears. The February jobs report was a wake-up call, showing a loss of 92,000 jobs — the worst contraction in years — while the unemployment rate ticked up to 4.4%. Normally, a weak labor market would prompt the Federal Reserve to cut rates, but the “energy tax” from $90 oil is keeping inflation sticky at 3%.
This puts the market in a vice. The Fed is essentially paralyzed, unable to rescue the economy with cheaper money because doing so would risk an inflationary spiral. Investors are realizing that the “Fed put” is currently out of money, leaving SPY without its most important safety net.
The consumer narrative is also shifting from revenge spending to bracing for recession. Recent surveys show that life satisfaction and economic expectations have hit 20-year lows, with only 59% of Americans expecting a high-quality life in the next five years.
While corporate earnings for the fourth quarter were technically strong, the forward-looking guidance is turning increasingly selective. The “other 493” companies — those outside the tech giants — are struggling with record-high margin debt and a cooling housing market. When the average American feels less wealthy due to rising insurance, rent, and fuel costs, the discretionary spending that fuels 70% of the S&P 500 begins to evaporate.
And as it relates to artificial intelligence (AI), with major tech firms projected to spend over $500 billion on AI infrastructure this year, the market is beginning to worry about a valuation hangover if these investments don't translate into bottom-line growth soon.
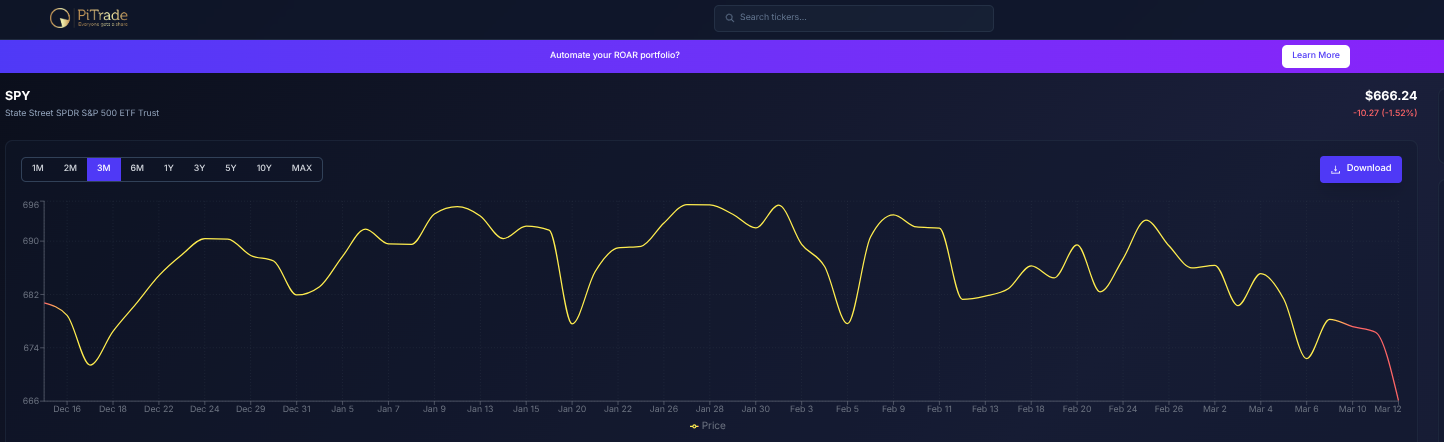
Finally, within my own proprietary research “lab,” SPY just saw its ROAR score cross into red (high-risk) territory for the first time in more than three months. It hung out in the yellow (low-neutral) area for some time and price movement followed — choppy, but nowhere. Now, that lower ROAR score/higher-risk signal is front of mind for me. As if the market said, “OK, now I’m ready to start really sliding.”
This is an ideal time to understand some of the basics of risk management. Inverse exchange-traded funds (ETFs) like the Short S&P500 -1X ETF (SH) and Short QQQ -1X ETF (PSQ) are one place to start researching. So is the simplicity of a cash pile as a defensive shield.
My other go-to is also on the simple side: continuing to own my favorites, but in smaller position sizes than during a more clear bullish market condition.
Rob Isbitts created the ROAR Score, based on his 40+ years of technical analysis experience. ROAR helps DIY investors manage risk and create their own portfolios. For Rob's written research, check out ETFYourself.com.
On the date of publication, Rob Isbitts did not have (either directly or indirectly) positions in any of the securities mentioned in this article. All information and data in this article is solely for informational purposes. For more information please view the Barchart Disclosure Policy here.
More news from Barchart
- 1 Trade to Make Now as Middle East Conflict Heats Up Inflation Fears
- The S&P 500 Is Walking a Tightrope — And It May Be About to Fall. Here's Why.
- Geologists Might Have Just Discovered the Largest Gold Mine in the World in China. How U.S. Gold Investors Should Position Now.
- S&P Futures Gain as Oil Prices Retreat, U.S. PCE Inflation and GDP Data in Focus