- Sales grew 18% to $185.1 million in the quarter
- Operating income was $1.7 million in the quarter, or 0.9% of sales
- Net loss for the quarter was $3.2 million, or $0.09 per diluted share
- Adjusted EBITDA1 was $19.1 million, or 10.3% of sales, an increase of $13.0 million over the first quarter of the prior year
- Bookings in the quarter were $205.3 million driving a record backlog of $612.5 million
- Aerospace achieved its ninth consecutive record backlog of $538.9 million
- Maintaining 2024 revenue guidance of approximately $760 million to $795 million
Astronics Corporation (Nasdaq: ATRO) (“Astronics” or the “Company”), a leading supplier of advanced technologies and products to the global aerospace, defense, and other mission-critical industries, today reported financial results for the three months ended March 30, 2024.
This press release features multimedia. View the full release here: https://www.businesswire.com/news/home/20240502839768/en/
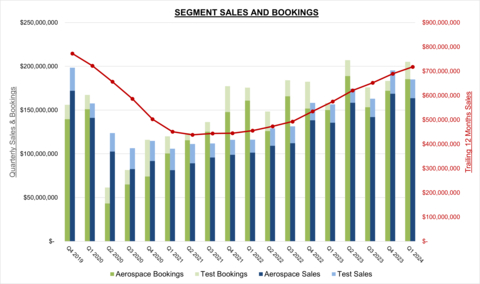
Astronics Segment Sales and Bookings (Graphic: Business Wire)
Peter J. Gundermann, Chairman, President and Chief Executive Officer, commented, “We had a very strong start to the year with first quarter revenue up 18% over the comparator quarter and easily beating our guidance for the quarter. Our financial results demonstrate our improved performance with first quarter adjusted EBITDA of $19 million, or 10.3% of sales. In addition, we had very strong bookings during the quarter, resulting in another record backlog. We are encouraged with the strong start to 2024 and believe we are well positioned to enjoy continued tailwinds throughout the remainder of the year.”
| _______________ | ||
1 |
|
Adjusted EBITDA is a Non-GAAP Performance Measure. Please see the attached table for a reconciliation of adjusted EBITDA to GAAP net loss. |
First Quarter Results
|
Three Months Ended |
|||||||||
($ in thousands) |
March 30,
|
|
April 1,
|
% Change |
||||||
|
|
|
|
|
||||||
Sales |
$ |
185,074 |
|
|
$ |
156,538 |
|
18.2 |
% |
|
Income (Loss) from Operations |
$ |
1,666 |
|
|
$ |
(2,370 |
) |
170.3 |
% |
|
Operating Margin % |
|
0.9 |
% |
|
|
(1.5 |
)% |
|
||
Net Gain on Sale of Business |
$ |
— |
|
|
$ |
(3,427 |
) |
|
||
Net Loss |
$ |
(3,178 |
) |
|
$ |
(4,415 |
) |
28.0 |
% |
|
Net Loss % |
|
(1.7 |
)% |
|
|
(2.8 |
)% |
|
||
|
|
|
|
|
||||||
*Adjusted EBITDA |
$ |
19,073 |
|
|
$ |
6,078 |
|
213.8 |
% |
|
*Adjusted EBITDA Margin % |
|
10.3 |
% |
|
|
3.9 |
% |
|
||
*Adjusted EBITDA is a Non-GAAP Performance Measure. Please see the attached table for a reconciliation of adjusted EBITDA to GAAP net loss. |
||||||||||
First Quarter 2024 Results (compared with the prior-year period, unless noted otherwise)
Consolidated sales were up $28.5 million, or 18.2%. Aerospace sales increased $28.0 million, or 20.7%, driven by increased demand in our Electrical Power & Motion product line. Test Systems sales increased $0.5 million.
Consolidated operating income was $1.7 million, compared with operating loss of $2.4 million in the prior-year period. Improved operating income reflects higher sales volume, partially offset by $3.6 million in non-cash stock bonuses as the Company’s bonus programs resumed. The prior-year period operating loss benefited from a $5.8 million liability reversal of a deferred revenue liability that increased sales in the Test Segment.
In the first quarter of 2023, the Company recognized a $3.4 million gain from the final earnout payment for the 2019 sale of its semiconductor test business, as well as $1.8 million within Other Income associated with the reversal of a liability related to an equity investment.
Consolidated net loss was $3.2 million, or $0.09 per diluted share, compared with net loss of $4.4 million, or $0.14 per diluted share, in the prior year. Tax benefit in the quarter was $1.4 million, compared with tax expense of $1.3 million in the prior year.
Consolidated adjusted EBITDA increased to $19.1 million, or 10.3% of consolidated sales, compared with adjusted EBITDA of $6.1 million, or 3.9% of consolidated sales, in the prior-year period primarily as a result of higher sales.
Bookings were $205.3 million in the quarter resulting in a book-to-bill ratio of 1.11:1. For the trailing twelve months, bookings totaled $771.6 million and the book-to-bill ratio was 1.08:1.
Aerospace Segment Review (refer to sales by market and segment data in accompanying tables)
Aerospace First Quarter 2024 Results (compared with the prior-year period, unless noted otherwise)
Aerospace segment sales increased $28.0 million, or 20.7%, to $163.6 million. The improvement was driven by a 28.9% increase, or $27.2 million, in commercial transport sales. Sales to this market were $121.4 million, or 65.6% of consolidated sales in the quarter, compared with $94.2 million, or 60.2% of consolidated sales in the first quarter of 2023. Higher airline spending and higher OEM build rates drove increased demand.
Military aircraft sales increased $3.0 million, or 21.4%, to $17.1 million. General Aviation sales increased $0.1 million, or 0.5%, to $19.6 million.
Aerospace segment operating profit of $12.1 million, or 7.4% of sales, compares with operating profit of $4.1 million, or 3.0% of sales, in the same period last year. Operating margin expansion reflects the leverage gained on higher volume and improving production efficiencies. Operating profit in the first quarter of 2024 was impacted by a $1.9 million increase in litigation-related legal expenses related to an ongoing patent dispute and the resumption of the Company’s bonus programs, which was $2.4 million.
Aerospace bookings were $185.3 million for a book-to-bill ratio of 1.13:1. Backlog for the Aerospace segment was a record $538.9 million at quarter end.
Mr. Gundermann commented, “We are seeing strong demand for our Aerospace products and technologies as the commercial aerospace industry continues to recover. The volume drives the strong operating leverage inherent in our business. Importantly as well, our workforce is stabilizing, our production efficiencies are improving and pricing has improved. As a result, and given our record Aerospace backlog, we expect sales and margins to continue to improve significantly as we move through 2024.”
Test Systems Segment Review (refer to sales by market and segment data in accompanying tables)
Test Systems First Quarter 2024 Results (compared with the prior-year period, unless noted otherwise)
Test Systems segment sales were $21.4 million, up $0.5 million.
Test Systems segment operating loss was $3.1 million, compared to operating loss of $0.6 million in the first quarter of 2023. Absent the sales adjustment resulting from the reversal of the deferred revenue liability, Test Systems operating loss for the prior-year period was $6.4 million. Test Systems’ operating loss continues to be negatively affected by mix and under absorption of fixed costs due to volume. The first quarter of 2024 included a $2.7 million decrease in litigation-related expenses partially offset by a $0.6 million increase in non-cash bonuses.
Given the continued delay in expected project awards, in April 2024 the Test Systems segment implemented additional restructuring initiatives to align the workforce and management structure with near-term revenue expectations and operational needs. These initiatives are expected to provide annualized savings of approximately $4 million, beginning in the third quarter.
Bookings for the Test Systems segment in the quarter were $20.0 million for a book-to-bill ratio of 0.93:1 for the quarter. Backlog was $73.6 million at the end of the first quarter of 2024 compared with a backlog of $86.3 million at the end of the first quarter of 2023.
Mr. Gundermann commented, “Our Test business began the year with revenue of $21.4 million, up $0.5 million over the first quarter of 2023 which benefited from $5.8 million in revenue from a reversal of a deferred revenue liability. Absent that impact, sales increased $6.3 million. The business has made good progress on a significant award opportunity with the U.S. Army, but there is more work to do. Shortly after the quarter ended, we took the necessary step to more closely align our cost structure with near-term financial expectations.”
Liquidity and Financing
Available liquidity at the end of the quarter was $22.9 million. Capital expenditures in the quarter were $1.6 million. Net debt was $160.0 million down from $161.2 million at December 31, 2023.
Cash provided by operations was $2.0 million in the first quarter of 2024 despite an $8.8 million increase in inventory which was primarily related to increased shipments scheduled for the remainder of 2024.
The Company executed a minor amendment to its credit agreement in late March 2024 to reestablish a $5 million accordion which had expired in January, and to better align certain covenant requirements to accommodate the rolling twelve-month financials. An additional $5 million of liquidity will be made available shortly following the filing of first quarter financial results and required documentation with lenders.
The Company did not sell any shares during the quarter via its ATM facility, which has $8 million of capacity remaining.
David Burney, the Company’s Chief Financial Officer, said, “We continue to make good progress with cash conversion through disciplined working capital management. Our inventory level of growth has moderated, while being carefully managed to build as needed with increased demand. Our receivables and accounts payable are in much better shape than they were through most of 2023. We believe we have sufficient liquidity to meet our current needs as we prepare for the acceleration we expect later in the year.”
2024 Outlook
The Company expects second quarter revenue to be in the range of $185 million to $195 million. The Company is maintaining its 2024 revenue guidance of approximately $760 million to $795 million. The midpoint of this range would be a 13% increase over 2023 sales. In maintaining guidance, Astronics expects to manage the broad and persuasive tailwinds across the business against the risk related to aircraft production rates.
Backlog at the end of the first quarter was a record $612.5 million, of which approximately $511.8 million is expected to ship in 2024. This represents about 86% of expected sales for the remainder of 2024 at the mid-point of the range, a relatively high level compared with historic experience.
Planned capital expenditures in 2024 are expected to be in the range of $17 million to $22 million.
Peter Gundermann commented, “We are feeling good about 2024. Our first quarter was stronger than expected, suggesting that our supply chain is continuing to improve and our team is getting more efficient. We believe that continued strong demand and customer enthusiasm will drive growth in coming quarters, which we expect to drive cash generation and improved profitability. We still have a ways to go, but our feeling today is that 2024 will be a year of strong growth and margin improvement for Astronics Corporation.”
First Quarter 2024 Webcast and Conference Call
The Company will host a teleconference today at 4:45 p.m. ET. During the teleconference, management will review the financial and operating results for the period and discuss Astronics’ corporate strategy and outlook. A question-and-answer session will follow.
The Astronics conference call can be accessed by calling (412) 317-0518. The listen-only audio webcast can be monitored at investors.astronics.com. To listen to the archived call, dial (412) 317-6671 and enter replay pin number 10188209. The telephonic replay will be available from 8:00 p.m. on the day of the call through Thursday, May 16, 2024. The webcast replay can be accessed via the investor relations section of the Company’s website where a transcript will also be posted once available.
About Astronics Corporation
Astronics Corporation (Nasdaq: ATRO) serves the world’s aerospace, defense, and other mission-critical industries with proven innovative technology solutions. Astronics works side-by-side with customers, integrating its array of power, connectivity, lighting, structures, interiors, and test technologies to solve complex challenges. For over 50 years, Astronics has delivered creative, customer-focused solutions with exceptional responsiveness. Today, global airframe manufacturers, airlines, military branches, completion centers, and Fortune 500 companies rely on the collaborative spirit and innovation of Astronics. The Company’s strategy is to increase its value by developing technologies and capabilities that provide innovative solutions to its targeted markets.
Safe Harbor Statement
This news release contains forward-looking statements as defined by the Securities Exchange Act of 1934. One can identify these forward-looking statements by the use of the words “expect,” “anticipate,” “plan,” “may,” “will,” “estimate,” “feeling” or other similar expressions and include all statements with regard to achieving any revenue or profitability expectations, the rate of recovery of the commercial aerospace widebody/long haul markets, aircraft production rates, the improvement in the supply chain, the productivity of manufacturing personnel and efficiency of staff, the effectiveness on profitability of cost reduction efforts, the effect of pricing on margins, the timing of receipt of task orders or future orders, the continued momentum in the business and favorable tailwinds, the level of liquidity and its sufficiency to meet current needs, the alignment of covenants to effectively accommodate rolling twelve-month financials, the rate of acceleration of the business, the level of cash generation, the expectations of customer enthusiasm and level of demand by customers and markets. Because such statements apply to future events, they are subject to risks and uncertainties that could cause actual results to differ materially from those contemplated by the statements. Important factors that could cause actual results to differ materially from what may be stated here include the impact of global pandemics and related governmental and other actions taken in response, the trend in growth with passenger power and connectivity on airplanes, the state of the aerospace and defense industries, the market acceptance of newly developed products, internal production capabilities, the timing of orders received, the status of customer certification processes and delivery schedules, the demand for and market acceptance of new or existing aircraft which contain the Company’s products, the impact of regulatory activity and public scrutiny on production rates of a major U.S. aircraft manufacturer, the need for new and advanced test and simulation equipment, customer preferences and relationships, the effectiveness of the Company’s supply chain, and other factors which are described in filings by Astronics with the Securities and Exchange Commission. The Company assumes no obligation to update forward-looking information in this news release whether to reflect changed assumptions, the occurrence of unanticipated events or changes in future operating results, financial conditions or prospects, or otherwise.
FINANCIAL TABLES FOLLOW
ASTRONICS CORPORATION |
|||||||
CONSOLIDATED STATEMENT OF OPERATIONS DATA |
|||||||
(Unaudited, $ in thousands except per share data) |
|||||||
|
|
||||||
|
Three Months Ended |
||||||
|
3/30/2024 |
|
4/1/2023 |
||||
Sales1 |
$ |
185,074 |
|
|
$ |
156,538 |
|
Cost of products sold |
|
150,883 |
|
|
|
129,028 |
|
Gross profit |
|
34,191 |
|
|
|
27,510 |
|
Gross margin |
|
18.5 |
% |
|
|
17.6 |
% |
|
|
|
|
||||
Selling, general and administrative |
|
32,525 |
|
|
|
29,880 |
|
SG&A % of sales |
|
17.6 |
% |
|
|
19.1 |
% |
Income (loss) from operations |
|
1,666 |
|
|
|
(2,370 |
) |
Operating margin |
|
0.9 |
% |
|
|
(1.5 |
)% |
|
|
|
|
||||
Net gain on sale of business2 |
|
— |
|
|
|
(3,427 |
) |
Other expense (income)3 |
|
436 |
|
|
|
(1,288 |
) |
Interest expense, net |
|
5,759 |
|
|
|
5,470 |
|
Loss before tax |
|
(4,529 |
) |
|
|
(3,125 |
) |
Income tax (benefit) expense |
|
(1,351 |
) |
|
|
1,290 |
|
Net loss |
$ |
(3,178 |
) |
|
$ |
(4,415 |
) |
Net loss % of sales |
|
(1.7 |
)% |
|
|
(2.8 |
)% |
|
|
|
|
||||
|
|
|
|
||||
Basic loss per share: |
$ |
(0.09 |
) |
|
$ |
(0.14 |
) |
Diluted loss per share: |
$ |
(0.09 |
) |
|
$ |
(0.14 |
) |
|
|
|
|
||||
Weighted average diluted shares outstanding (in thousands) |
|
34,863 |
|
|
|
32,505 |
|
|
|
|
|
||||
Capital expenditures |
$ |
1,598 |
|
|
$ |
1,573 |
|
Depreciation and amortization |
$ |
6,328 |
|
|
$ |
6,662 |
|
| _______________ | ||
1 |
|
In the quarter ended April 1, 2023, $5.8 million was recognized in sales related to the reversal of a deferred revenue liability recorded with a previous acquisition within our Test Systems Segment. |
2 |
|
Net gain on sale of business for the quarter ended April 1, 2023 is comprised of the additional gain on the sale of the Company’s former semiconductor test business resulting from the contingent earnout for the 2022 calendar year. |
3 |
|
Other expense (income) for the quarter ended April 1, 2023 includes income of $1.8 million associated with the reversal of a liability related to an equity investment, as we will no longer be required to make the associated payment. |
Reconciliation to Non-GAAP Performance Measures
In addition to reporting net income, a U.S. generally accepted accounting principle (“GAAP”) measure, we present Adjusted EBITDA (earnings before interest, income taxes, depreciation and amortization, non-cash equity-based compensation expense, goodwill, intangible and long-lived asset impairment charges, equity investment income or loss, legal reserves, settlements and recoveries, restructuring charges, gains or losses associated with the sale of businesses and grant benefits recorded related to the AMJP program), which is a non-GAAP measure. The Company’s management believes Adjusted EBITDA is an important measure of operating performance because it allows management, investors and others to evaluate and compare the performance of its core operations from period to period by removing the impact of the capital structure (interest), tangible and intangible asset base (depreciation and amortization), taxes, equity-based compensation expense, goodwill, intangible and long-lived asset impairment charges, equity investment income or loss, non-cash reserves related to customer bankruptcy filings, legal reserves, settlements and recoveries, litigation-related expenses, restructuring charges, gains or losses associated with the sale of businesses and grant benefits recorded related to the AMJP program, which is not commensurate with the core activities of the reporting period in which it is included. As such, the Company uses Adjusted EBITDA as a measure of performance when evaluating its business and as a basis for planning and forecasting. Adjusted EBITDA is not a measure of financial performance under GAAP and is not calculated through the application of GAAP. As such, it should not be considered as a substitute for the GAAP measure of net income and, therefore, should not be used in isolation of, but in conjunction with, the GAAP measure. Adjusted EBITDA, as presented, may produce results that vary from the GAAP measure and may not be comparable to a similarly defined non-GAAP measure used by other companies.
ASTRONICS CORPORATION |
|||||||
RECONCILIATION OF NET LOSS TO ADJUSTED EBITDA |
|||||||
(Unaudited, $ in thousands) |
|||||||
|
|
|
|
||||
|
Consolidated |
||||||
|
Three Months Ended |
||||||
|
3/30/2024 |
|
4/1/2023 |
||||
Net loss |
$ |
(3,178 |
) |
|
$ |
(4,415 |
) |
Add back (deduct): |
|
|
|
||||
Interest expense |
|
5,759 |
|
|
|
5,470 |
|
Income tax (benefit) expense |
|
(1,351 |
) |
|
|
1,290 |
|
Depreciation and amortization expense |
|
6,328 |
|
|
|
6,662 |
|
Equity-based compensation expense |
|
2,802 |
|
|
|
2,399 |
|
Non-cash annual stock bonus accrual |
|
1,448 |
|
|
|
— |
|
Non-cash 401K contribution and quarterly bonus accrual |
|
3,454 |
|
|
|
1,208 |
|
Restructuring-related charges including severance |
|
117 |
|
|
|
— |
|
Litigation-related legal expenses |
|
3,694 |
|
|
|
4,515 |
|
Equity investment accrued payable write-off |
|
— |
|
|
|
(1,800 |
) |
Net gain on sale of business |
|
— |
|
|
|
(3,427 |
) |
Deferred liability recovery |
|
— |
|
|
|
(5,824 |
) |
Adjusted EBITDA |
$ |
19,073 |
|
|
$ |
6,078 |
|
|
|
|
|
||||
Sales |
$ |
185,074 |
|
|
$ |
156,538 |
|
Adjusted EBITDA margin on sales |
10.3 |
% |
|
3.9 |
% |
||
ASTRONICS CORPORATION |
|||||||
CONSOLIDATED BALANCE SHEET DATA |
|||||||
($ in thousands) |
|||||||
|
(unaudited) |
|
|
||||
|
3/30/2024 |
|
12/31/2023 |
||||
ASSETS |
|
|
|
||||
Cash and cash equivalents |
$ |
5,308 |
|
|
$ |
4,756 |
|
Restricted cash |
|
1,302 |
|
|
|
6,557 |
|
Accounts receivable and uncompleted contracts |
|
170,246 |
|
|
|
172,108 |
|
Inventories |
|
199,497 |
|
|
|
191,801 |
|
Other current assets |
|
15,541 |
|
|
|
14,560 |
|
Property, plant and equipment, net |
|
83,684 |
|
|
|
85,436 |
|
Other long-term assets |
|
34,109 |
|
|
|
34,944 |
|
Intangible assets, net |
|
62,121 |
|
|
|
65,420 |
|
Goodwill |
|
58,156 |
|
|
|
58,210 |
|
Total assets |
$ |
629,964 |
|
|
$ |
633,792 |
|
|
|
|
|
||||
LIABILITIES AND SHAREHOLDERS' EQUITY |
|
|
|
||||
Current maturities of long-term debt |
$ |
8,996 |
|
|
$ |
8,996 |
|
Accounts payable and accrued expenses |
|
122,026 |
|
|
112,309 |
||
Customer advances and deferred revenue |
|
20,257 |
|
|
|
22,029 |
|
Long-term debt |
|
153,149 |
|
|
|
159,237 |
|
Other liabilities |
|
73,813 |
|
|
|
81,703 |
|
Shareholders' equity |
|
251,723 |
|
|
|
249,518 |
|
Total liabilities and shareholders' equity |
$ |
629,964 |
|
|
$ |
633,792 |
|
ASTRONICS CORPORATION |
|||||||
CONSOLIDATED CASH FLOWS DATA |
|||||||
|
|
|
|
||||
|
Three Months Ended |
||||||
(Unaudited, $ in thousands) |
3/30/2024 |
|
4/1/2023 |
||||
Cash flows from operating activities: |
|
|
|
||||
Net loss |
$ |
(3,178 |
) |
|
$ |
(4,415 |
) |
Adjustments to reconcile net loss to cash from operating activities: |
|
|
|
||||
Non-cash items: |
|
|
|
||||
Depreciation and amortization |
|
6,328 |
|
|
|
6,662 |
|
Amortization of deferred financing fees |
|
832 |
|
|
|
616 |
|
Provisions for non-cash losses on inventory and receivables |
|
767 |
|
|
|
627 |
|
Equity-based compensation expense |
|
2,802 |
|
|
|
2,399 |
|
Net gain on sale of business |
|
— |
|
|
|
(3,427 |
) |
Operating lease non-cash expense |
|
1,280 |
|
|
|
1,186 |
|
Non-cash 401K contribution and quarterly bonus accrual |
|
3,454 |
|
|
|
1,208 |
|
Non-cash annual stock bonus accrual |
|
1,448 |
|
|
|
— |
|
Non-cash deferred liability reversal |
|
— |
|
|
|
(5,824 |
) |
Other |
|
968 |
|
|
|
(525 |
) |
Cash flows from changes in operating assets and liabilities: |
|
|
|
||||
Accounts receivable |
|
1,427 |
|
|
|
(4,170 |
) |
Inventories |
|
(8,826 |
) |
|
|
(13,860 |
) |
Accounts payable |
|
224 |
|
|
|
(3,488 |
) |
Accrued expenses |
|
(1,717 |
) |
|
|
2,944 |
|
Income taxes |
|
(1,722 |
) |
|
|
1,262 |
|
Operating lease liabilities |
|
(1,196 |
) |
|
|
(1,447 |
) |
Customer advance payments and deferred revenue |
|
(1,685 |
) |
|
|
1,190 |
|
Supplemental retirement plan liabilities |
|
(101 |
) |
|
|
(100 |
) |
Other assets and liabilities |
|
932 |
|
|
|
(19 |
) |
Net cash provided (used) by operating activities |
|
2,037 |
|
|
|
(19,181 |
) |
Cash flows from investing activities: |
|
|
|
||||
Proceeds on sale of business and assets |
|
— |
|
|
|
3,437 |
|
Capital expenditures |
|
(1,598 |
) |
|
|
(1,573 |
) |
Net cash (used) provided by investing activities |
|
(1,598 |
) |
|
|
1,864 |
|
Cash flows from financing activities: |
|
|
|
||||
Proceeds from long-term debt |
|
1,356 |
|
|
|
126,122 |
|
Principal payments on long-term debt |
|
(7,249 |
) |
|
|
(111,986 |
) |
Stock award and employee stock purchase plan activity |
|
1,713 |
|
|
|
(602 |
) |
Finance lease principal payments |
|
(53 |
) |
|
|
(11 |
) |
Financing-related costs |
|
(809 |
) |
|
|
(4,347 |
) |
Net cash (used) provided by financing activities |
|
(5,042 |
) |
|
|
9,176 |
|
Effect of exchange rates on cash |
|
(100 |
) |
|
|
80 |
|
Decrease in cash and cash equivalents and restricted cash |
|
(4,703 |
) |
|
|
(8,061 |
) |
Cash and cash equivalents and restricted cash at beginning of period |
|
11,313 |
|
|
|
13,778 |
|
Cash and cash equivalents and restricted cash at end of period |
$ |
6,610 |
|
|
$ |
5,717 |
|
ASTRONICS CORPORATION |
|||||||
SEGMENT DATA |
|||||||
(Unaudited, $ in thousands) |
|||||||
|
|
||||||
|
Three Months Ended |
||||||
|
3/30/2024 |
4/1/2023 |
|||||
Sales |
|
|
|||||
Aerospace |
$ |
163,675 |
|
$ |
135,715 |
|
|
Less inter-segment |
|
(37 |
) |
|
(118 |
) |
|
Total Aerospace |
|
163,638 |
|
|
135,597 |
|
|
|
|
|
|||||
Test Systems1 |
|
21,436 |
|
|
20,941 |
|
|
Less inter-segment |
|
— |
|
|
— |
|
|
Total Test Systems |
|
21,436 |
|
|
20,941 |
|
|
|
|
|
|||||
Total consolidated sales |
|
185,074 |
|
|
156,538 |
|
|
|
|
|
|||||
Segment operating profit and margins |
|
|
|||||
Aerospace |
|
12,097 |
|
|
4,087 |
|
|
|
|
7.4 |
% |
|
3.0 |
% |
|
Test Systems1 |
|
(3,079 |
) |
|
(597 |
) |
|
|
|
(14.4 |
)% |
|
(2.9 |
)% |
|
Total segment operating profit |
|
9,018 |
|
|
3,490 |
|
|
|
|
|
|||||
|
|
|
|||||
Net gain on sale of business |
|
— |
|
|
(3,427 |
) |
|
Interest expense |
|
5,759 |
|
|
5,470 |
|
|
Corporate expenses and other2 |
|
7,788 |
|
|
4,572 |
|
|
Loss before taxes |
$ |
(4,529 |
) |
$ |
(3,125 |
) |
|
| _______________ | ||
1 |
|
In the quarter ended April 1, 2023, $5.8 million was recognized in sales related to the reversal of a deferred revenue liability recorded with a previous acquisition within our Test Systems Segment, which also benefits operating loss for the period. Absent that benefit, Test Systems operating loss was $6.4 million. |
2 |
|
Corporate expenses and other for the quarter ended April 1, 2023 includes income of $1.8 million associated with the reversal of a liability related to an equity investment, as we will no longer be required to make the associated payment. |
ASTRONICS CORPORATION |
||||||||
SALES BY MARKET |
||||||||
(Unaudited, $ in thousands) |
||||||||
|
|
|
||||||
|
Three Months Ended |
2024 YTD |
||||||
|
3/30/2024 |
4/1/2023 |
% Change |
% of Sales |
||||
Aerospace Segment |
|
|
|
|
||||
Commercial Transport |
$ |
121,430 |
$ |
94,213 |
28.9 |
% |
65.6 |
% |
Military Aircraft |
|
17,079 |
|
14,064 |
21.4 |
% |
9.2 |
% |
General Aviation |
|
19,551 |
|
19,448 |
0.5 |
% |
10.6 |
% |
Other |
|
5,578 |
|
7,872 |
(29.1 |
)% |
3.0 |
% |
Aerospace Total |
|
163,638 |
|
135,597 |
20.7 |
% |
88.4 |
% |
|
|
|
|
|
||||
Test Systems Segment1 |
|
|
|
|
||||
Government & Defense |
|
21,436 |
|
20,941 |
2.4 |
% |
11.6 |
% |
|
|
|
|
|
||||
Total Sales |
$ |
185,074 |
$ |
156,538 |
18.2 |
% |
|
|
SALES BY PRODUCT LINE |
||||||||
(Unaudited, $ in thousands) |
||||||||
|
|
|
||||||
|
Three Months Ended |
2024 YTD |
||||||
3/30/2024 |
4/1/2023 |
% Change |
% of Sales |
|||||
Aerospace Segment |
|
|
|
|
||||
Electrical Power & Motion |
$ |
83,124 |
$ |
53,454 |
55.5 |
% |
44.9 |
% |
Lighting & Safety |
|
41,787 |
|
36,553 |
14.3 |
% |
22.6 |
% |
Avionics |
|
25,594 |
|
29,741 |
(13.9 |
)% |
13.8 |
% |
Systems Certification |
|
4,448 |
|
5,677 |
(21.6 |
)% |
2.4 |
% |
Structures |
|
3,107 |
|
2,300 |
35.1 |
% |
1.7 |
% |
Other |
|
5,578 |
|
7,872 |
(29.1 |
)% |
3.0 |
% |
Aerospace Total |
|
163,638 |
|
135,597 |
20.7 |
% |
88.4 |
% |
|
|
|
|
|
||||
Test Systems Segment1 |
|
21,436 |
|
20,941 |
2.4 |
% |
11.6 |
% |
|
|
|
|
|
||||
Total Sales |
$ |
185,074 |
$ |
156,538 |
18.2 |
% |
|
|
| _______________ | ||
1 |
|
Test Systems sales in the quarter ended April 1, 2023 included a $5.8 million reversal of a deferred revenue liability recorded with a previous acquisition. |
ASTRONICS CORPORATION |
||||||||||
ORDER AND BACKLOG TREND |
||||||||||
(Unaudited, $ in thousands) |
||||||||||
|
Q2 2023 |
Q3 2023 |
Q4 2023 |
Q1 2024 |
Trailing Twelve Months |
|||||
|
7/1/2023 |
9/30/2023 |
12/31/2023 |
3/30/2024 |
3/30/2024 |
|||||
Sales |
|
|
|
|
|
|||||
Aerospace |
$ |
158,382 |
$ |
142,104 |
$ |
168,747 |
$ |
163,638 |
$ |
632,871 |
Test Systems |
|
16,072 |
|
20,818 |
|
26,545 |
|
21,436 |
|
84,871 |
Total Sales |
$ |
174,454 |
$ |
162,922 |
$ |
195,292 |
$ |
185,074 |
$ |
717,742 |
|
|
|
|
|
|
|||||
Bookings |
|
|
|
|
|
|||||
Aerospace |
$ |
188,800 |
$ |
153,272 |
$ |
172,106 |
$ |
185,269 |
$ |
699,447 |
Test Systems |
|
18,252 |
|
22,724 |
|
11,176 |
|
19,986 |
|
72,138 |
Total Bookings |
$ |
207,052 |
$ |
175,996 |
$ |
183,282 |
$ |
205,255 |
$ |
771,585 |
|
|
|
|
|
|
|||||
Backlog |
|
|
|
|
|
|||||
Aerospace1 |
$ |
502,713 |
$ |
513,881 |
$ |
517,240 |
$ |
538,871 |
|
|
Test Systems |
|
88,499 |
|
90,405 |
|
75,036 |
|
73,586 |
|
|
Total Backlog |
$ |
591,212 |
$ |
604,286 |
$ |
592,276 |
$ |
612,457 |
|
N/A |
|
|
|
|
|
|
|||||
Book:Bill Ratio |
|
|
|
|
|
|||||
Aerospace |
|
1.19 |
|
1.08 |
|
1.02 |
|
1.13 |
|
1.11 |
Test Systems |
|
1.14 |
|
1.09 |
|
0.42 |
|
0.93 |
|
0.85 |
Total Book:Bill |
|
1.19 |
|
1.08 |
|
0.94 |
|
1.11 |
|
1.08 |
| _______________ | ||
1 |
|
In November of 2023, a non-core contract manufacturing customer reported within the Aerospace segment declared bankruptcy, and as a result, Aerospace and Total Backlog was reduced by $19.9 million in all periods affected. In the bar chart presented above, Aerospace and Total Bookings was reduced by $2.6 million and $17.2 million in second and third quarters of 2021, respectively. |
View source version on businesswire.com: https://www.businesswire.com/news/home/20240502839768/en/
Contacts
Company:
David C. Burney, Chief Financial Officer
Phone: (716) 805-1599, ext. 159
Email: david.burney@astronics.com
Investor Relations:
Deborah K. Pawlowski, Kei Advisors LLC
Phone: (716) 843-3908
Email: dpawlowski@keiadvisors.com


