
Cruise vacation company Royal Caribbean (NYSE: RCL) missed Wall Street’s revenue expectations in Q3 CY2025, but sales rose 5.2% year on year to $5.14 billion. Its non-GAAP profit of $5.75 per share was 1.2% above analysts’ consensus estimates.
Is now the time to buy Royal Caribbean? Find out by accessing our full research report, it’s free for active Edge members.
Royal Caribbean (RCL) Q3 CY2025 Highlights:
- Revenue: $5.14 billion vs analyst estimates of $5.16 billion (5.2% year-on-year growth, 0.5% miss)
- Adjusted EPS: $5.75 vs analyst estimates of $5.68 (1.2% beat)
- Adjusted EBITDA: $2.29 billion vs analyst estimates of $2.2 billion (44.6% margin, 4.2% beat)
- Management slightly raised its full-year Adjusted EPS guidance to $15.61 at the midpoint
- Operating Margin: 33.1%, in line with the same quarter last year
- Free Cash Flow was -$989 million, down from $563 million in the same quarter last year
- Passenger Cruise Days: 15.36 million, up 570,443 year on year
- Market Capitalization: $86.99 billion
"We continue to see strong momentum across our business, powered by accelerated demand, growing loyalty, and guest satisfaction that is at all-time highs. Our commercial flywheel - combining innovative ships, distinctive destinations, and world-class brands - continues to drive sustained growth and guests' trust in our ability to deliver the best vacation experiences responsibly," said Royal Caribbean Group President and CEO Jason Liberty.
Company Overview
Established in 1968, Royal Caribbean Cruises (NYSE: RCL) is a global cruise vacation company renowned for its innovative and exciting cruise experiences.
Revenue Growth
Examining a company’s long-term performance can provide clues about its quality. Even a bad business can shine for one or two quarters, but a top-tier one grows for years. Thankfully, Royal Caribbean’s 30% annualized revenue growth over the last five years was incredible. Its growth beat the average consumer discretionary company and shows its offerings resonate with customers.
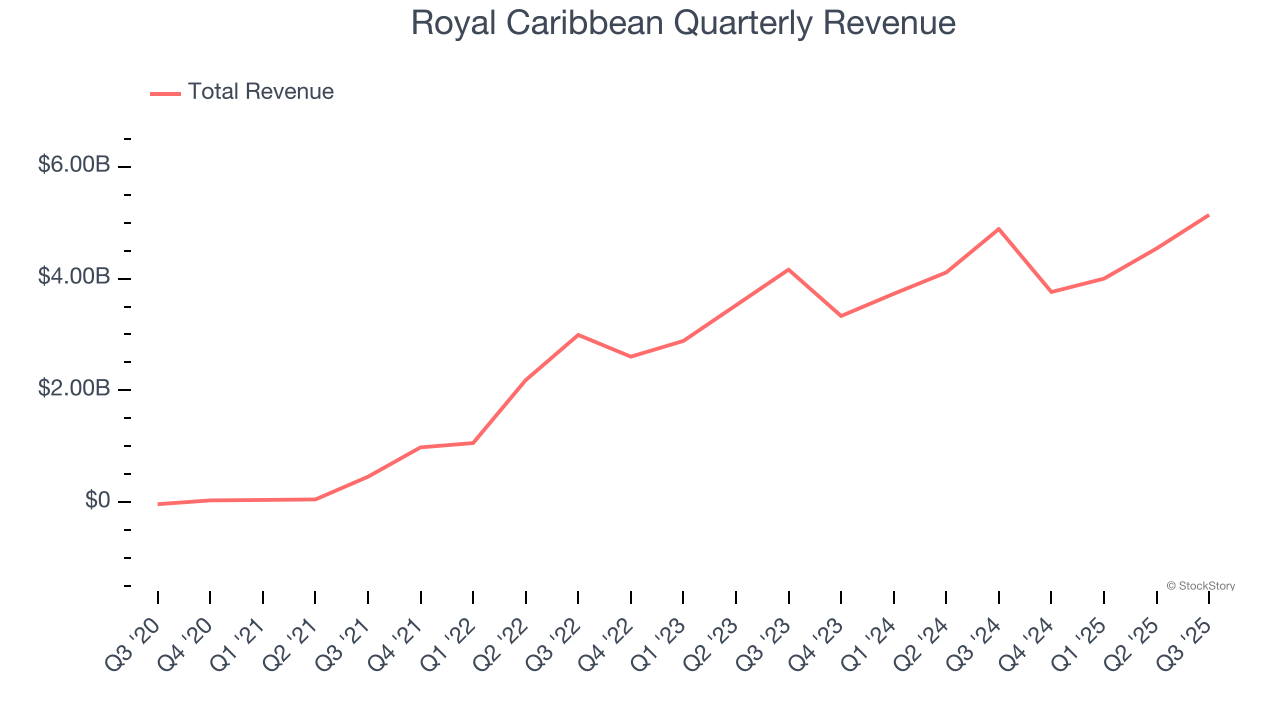
We at StockStory place the most emphasis on long-term growth, but within consumer discretionary, a stretched historical view may miss a company riding a successful new property or trend. Royal Caribbean’s annualized revenue growth of 15.1% over the last two years is below its five-year trend, but we still think the results were respectable. 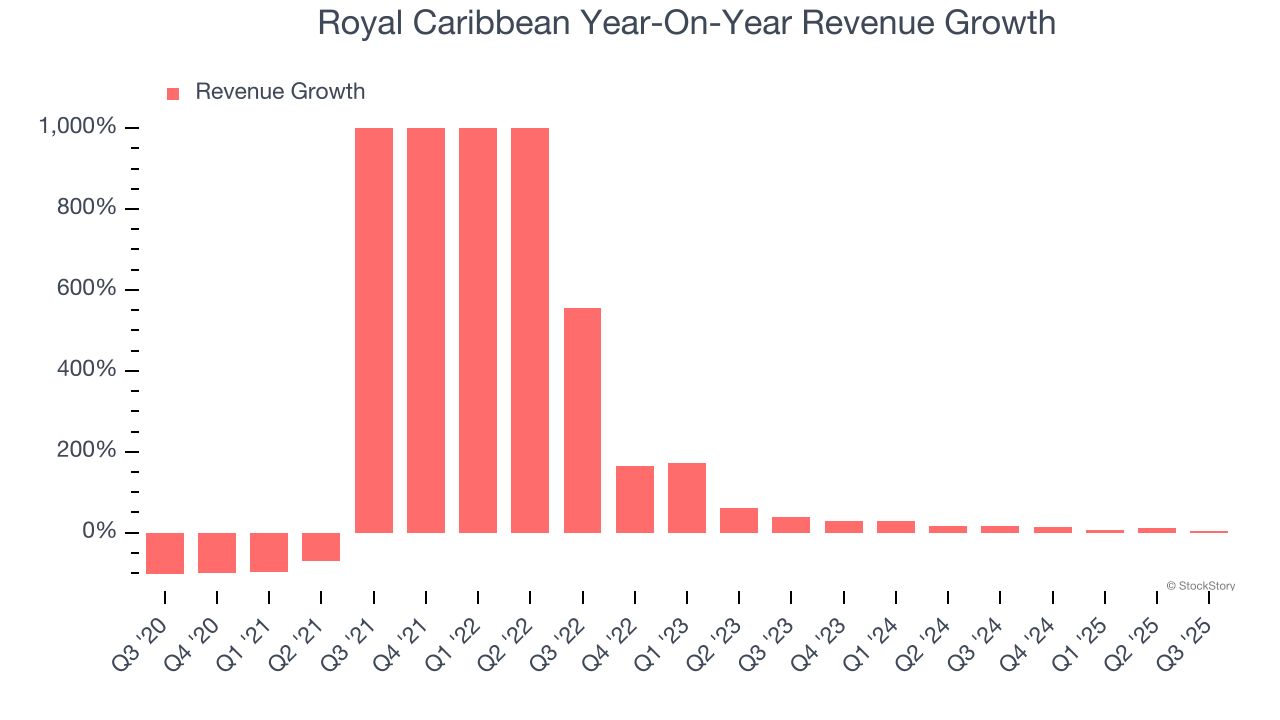
We can dig further into the company’s revenue dynamics by analyzing its number of passenger cruise days, which reached 15.36 million in the latest quarter. Over the last two years, Royal Caribbean’s passenger cruise days averaged 9.2% year-on-year growth. Because this number is lower than its revenue growth during the same period, we can see the company’s monetization has risen. 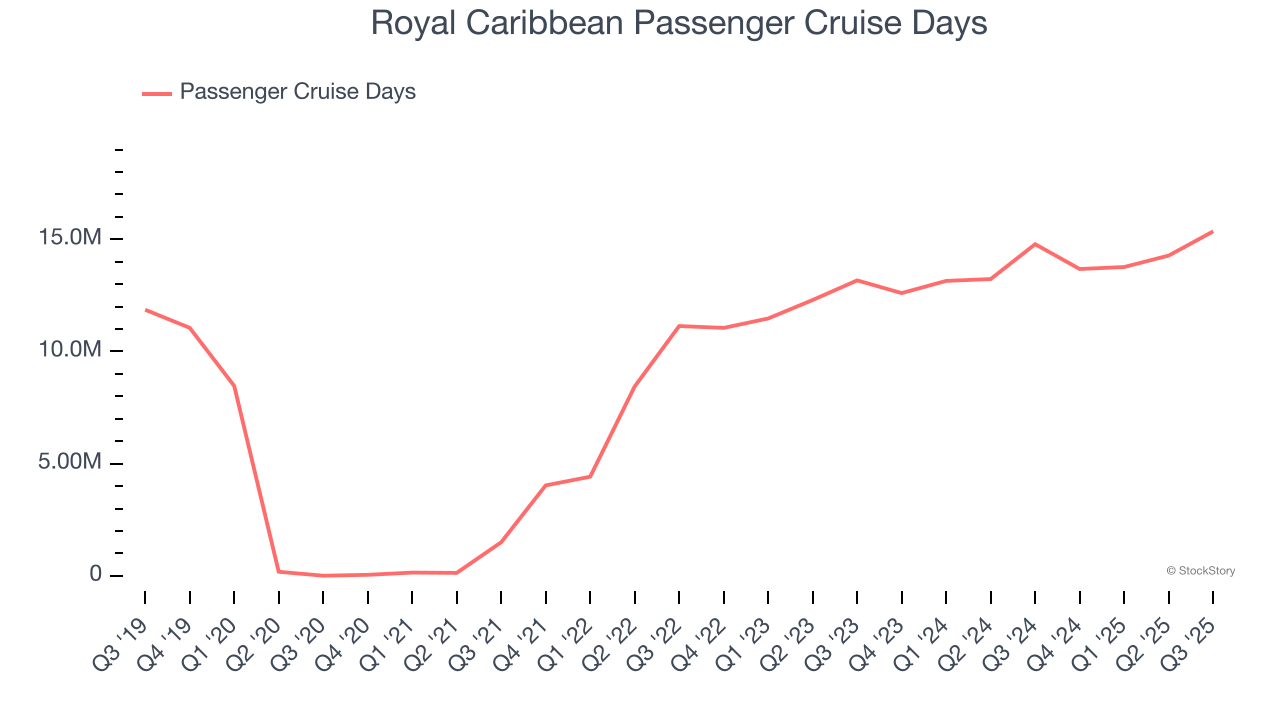
This quarter, Royal Caribbean’s revenue grew by 5.2% year on year to $5.14 billion, missing Wall Street’s estimates.
Looking ahead, sell-side analysts expect revenue to grow 11% over the next 12 months, a deceleration versus the last two years. This projection doesn't excite us and implies its products and services will face some demand challenges.
Today’s young investors won’t have read the timeless lessons in Gorilla Game: Picking Winners In High Technology because it was written more than 20 years ago when Microsoft and Apple were first establishing their supremacy. But if we apply the same principles, then enterprise software stocks leveraging their own generative AI capabilities may well be the Gorillas of the future. So, in that spirit, we are excited to present our Special Free Report on a profitable, fast-growing enterprise software stock that is already riding the automation wave and looking to catch the generative AI next.
Operating Margin
Royal Caribbean’s operating margin has risen over the last 12 months and averaged 25.8% over the last two years. On top of that, its profitability was elite for a consumer discretionary business, showing it’s a well-oiled machine with an efficient cost structure that benefits from immense operating leverage as it scales.
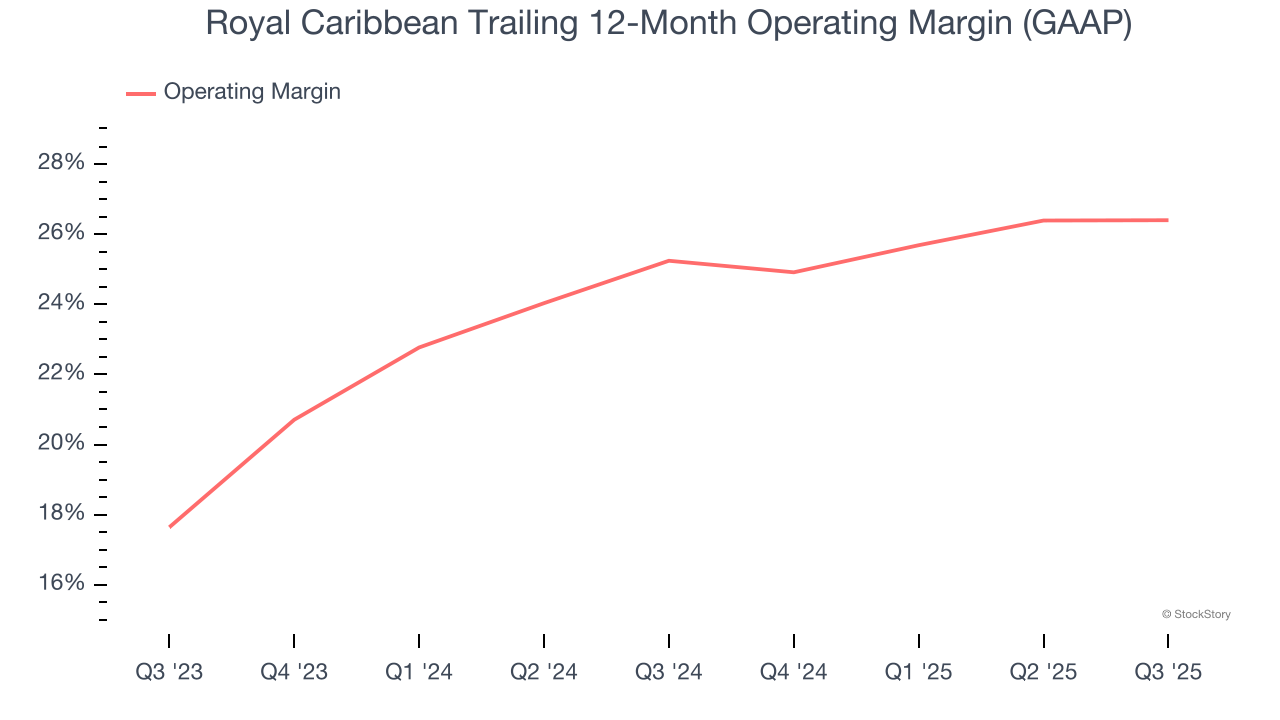
This quarter, Royal Caribbean generated an operating margin profit margin of 33.1%, in line with the same quarter last year. This indicates the company’s overall cost structure has been relatively stable.
Earnings Per Share
We track the long-term change in earnings per share (EPS) for the same reason as long-term revenue growth. Compared to revenue, however, EPS highlights whether a company’s growth is profitable.
Royal Caribbean’s full-year EPS flipped from negative to positive over the last five years. This is a good sign and shows it’s at an inflection point.
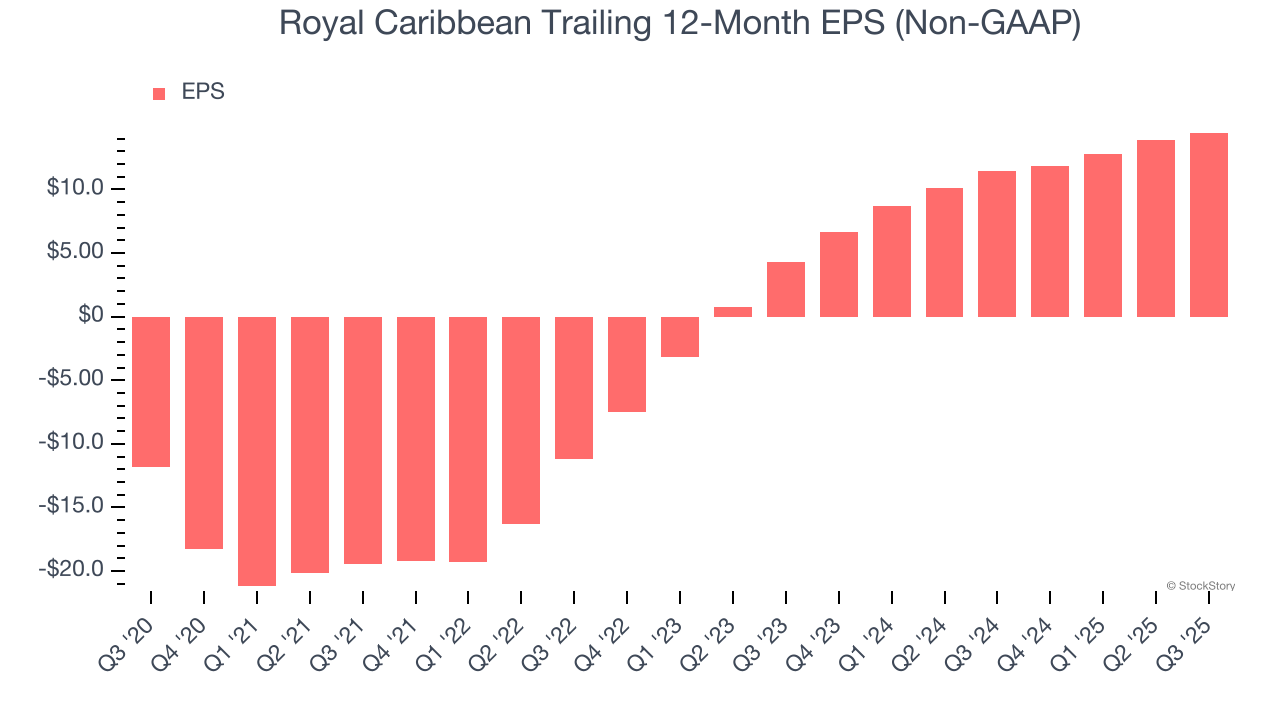
In Q3, Royal Caribbean reported adjusted EPS of $5.75, up from $5.20 in the same quarter last year. This print beat analysts’ estimates by 1.2%. Over the next 12 months, Wall Street expects Royal Caribbean’s full-year EPS of $14.47 to grow 21.5%.
Key Takeaways from Royal Caribbean’s Q3 Results
It was encouraging to see Royal Caribbean beat analysts’ EBITDA expectations this quarter. On the other hand, its EPS guidance for next quarter missed and its revenue fell slightly short of Wall Street’s estimates. Overall, this was a weaker quarter. The stock traded down 9.5% to $289.83 immediately after reporting.
Is Royal Caribbean an attractive investment opportunity at the current price? We think that the latest quarter is only one piece of the longer-term business quality puzzle. Quality, when combined with valuation, can help determine if the stock is a buy. We cover that in our actionable full research report which you can read here, it’s free for active Edge members.


