
Global airline American Airlines (NASDAQ: AAL) met Wall Street’s revenue expectations in Q1 CY2025, but sales were flat year on year at $12.55 billion. Its non-GAAP loss of $0.59 per share was 12.1% above analysts’ consensus estimates.
Is now the time to buy American Airlines? Find out by accessing our full research report, it’s free.
American Airlines (AAL) Q1 CY2025 Highlights:
- Revenue: $12.55 billion vs analyst estimates of $12.53 billion (flat year on year, in line)
- Adjusted EPS: -$0.59 vs analyst estimates of -$0.67 (12.1% beat)
- Adjusted EPS guidance for Q2 CY2025 is $0.75 at the midpoint, below analyst estimates of $1.01
- Operating Margin: -2.2%, down from 0.1% in the same quarter last year
- Free Cash Flow Margin: 13%, up from 10.8% in the same quarter last year
- Revenue Passenger Miles: 56.36 billion, down 1.12 billion year on year
- Market Capitalization: $6.13 billion
“The actions American has taken over the past several years to refresh our fleet, manage costs and strengthen our balance sheet position us well for the uncertainty our industry is facing,” said American’s CEO Robert Isom.
Company Overview
One of the ‘Big Four’ airlines in the US, American Airlines (NASDAQ: AAL) is a major global air carrier that serves both business and leisure travelers through its domestic and international flights.
Travel and Vacation Providers
Airlines, hotels, resorts, and cruise line companies often sell experiences rather than tangible products, and in the last decade-plus, consumers have slowly shifted from buying "things" (wasteful) to buying "experiences" (memorable). In addition, the internet has introduced new ways of approaching leisure and lodging such as booking homes and longer-term accommodations. Traditional airlines, hotel, resorts, and cruise line companies must innovate to stay relevant in a market rife with innovation.
Sales Growth
A company’s long-term sales performance can indicate its overall quality. Even a bad business can shine for one or two quarters, but a top-tier one grows for years. Unfortunately, American Airlines’s 4.4% annualized revenue growth over the last five years was sluggish. This fell short of our benchmark for the consumer discretionary sector and is a poor baseline for our analysis.
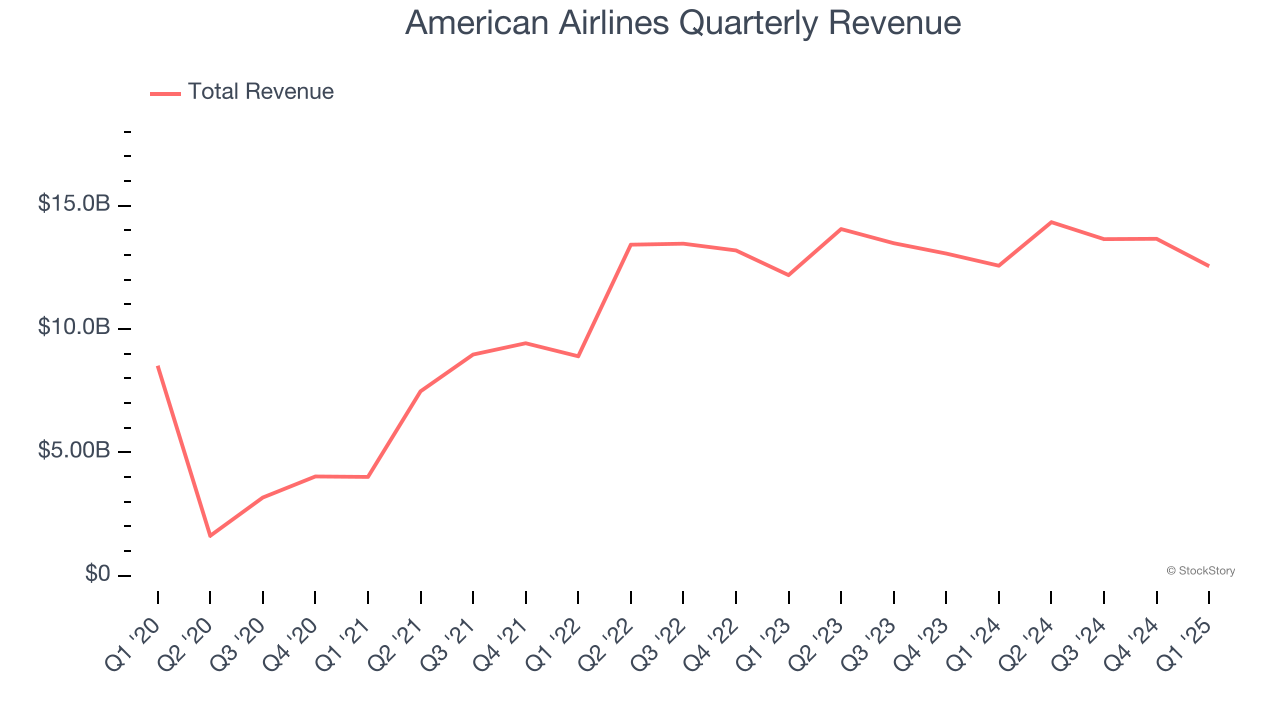
We at StockStory place the most emphasis on long-term growth, but within consumer discretionary, a stretched historical view may miss a company riding a successful new property or trend. American Airlines’s recent performance shows its demand has slowed as its annualized revenue growth of 1.8% over the last two years was below its five-year trend. 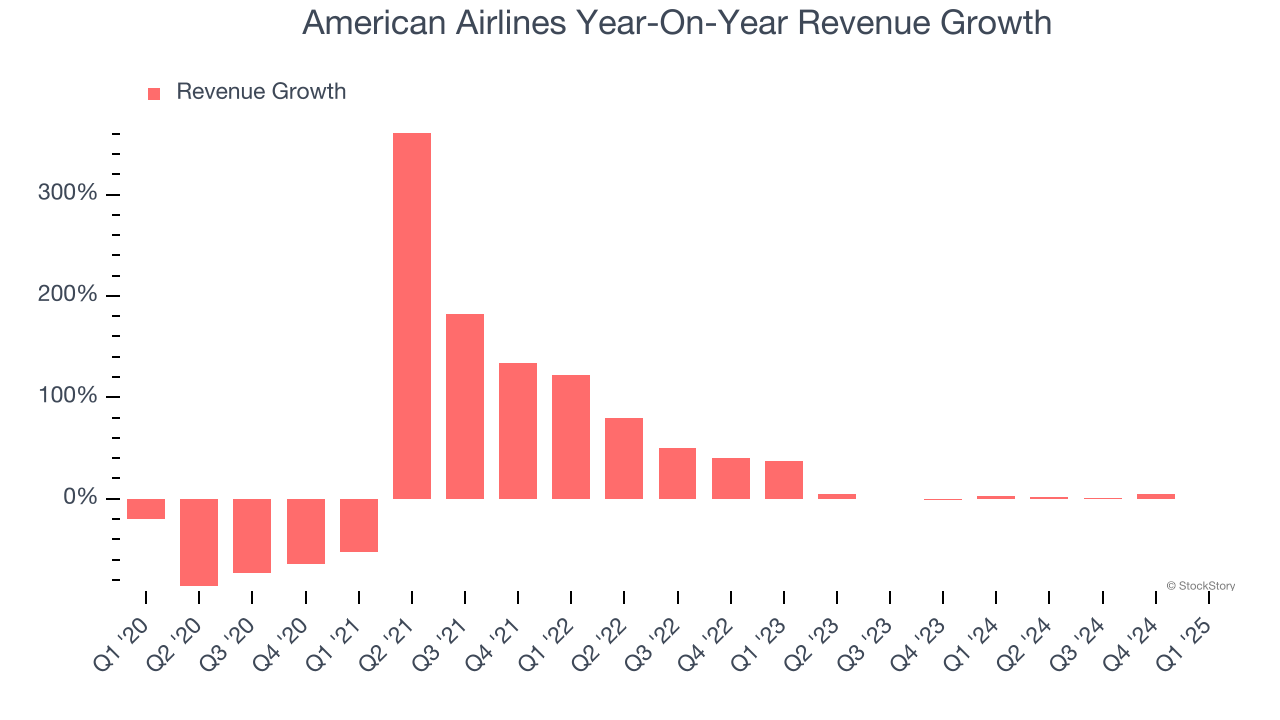
We can better understand the company’s revenue dynamics by analyzing its number of revenue passenger miles, which reached 56.36 billion in the latest quarter. Over the last two years, American Airlines’s revenue passenger miles averaged 5.3% year-on-year growth. Because this number is higher than its revenue growth during the same period, we can see the company’s monetization has fallen. 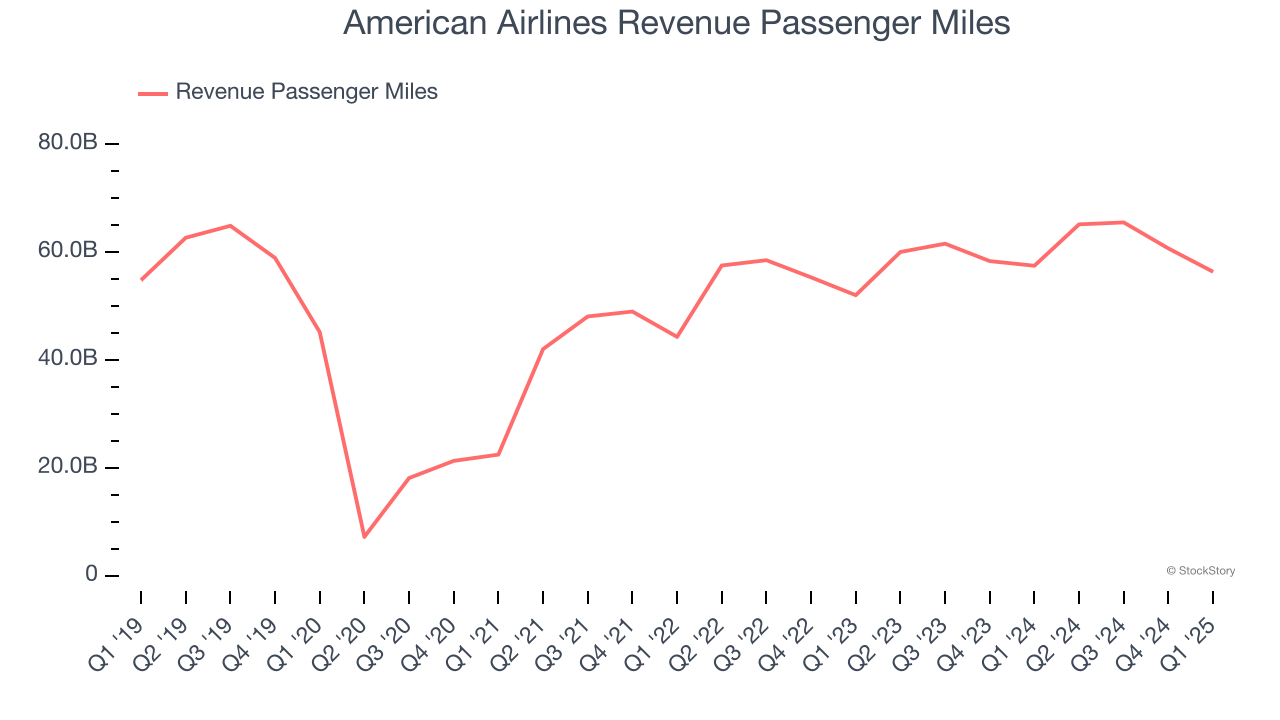
This quarter, American Airlines’s $12.55 billion of revenue was flat year on year and in line with Wall Street’s estimates.
Looking ahead, sell-side analysts expect revenue to grow 3.5% over the next 12 months. Although this projection implies its newer products and services will fuel better top-line performance, it is still below the sector average.
Here at StockStory, we certainly understand the potential of thematic investing. Diverse winners from Microsoft (MSFT) to Alphabet (GOOG), Coca-Cola (KO) to Monster Beverage (MNST) could all have been identified as promising growth stories with a megatrend driving the growth. So, in that spirit, we’ve identified a relatively under-the-radar profitable growth stock benefiting from the rise of AI, available to you FREE via this link.
Operating Margin
Operating margin is a key measure of profitability. Think of it as net income - the bottom line - excluding the impact of taxes and interest on debt, which are less connected to business fundamentals.
American Airlines’s operating margin might fluctuated slightly over the last 12 months but has generally stayed the same, averaging 4.6% over the last two years. This profitability was lousy for a consumer discretionary business and caused by its suboptimal cost structure.
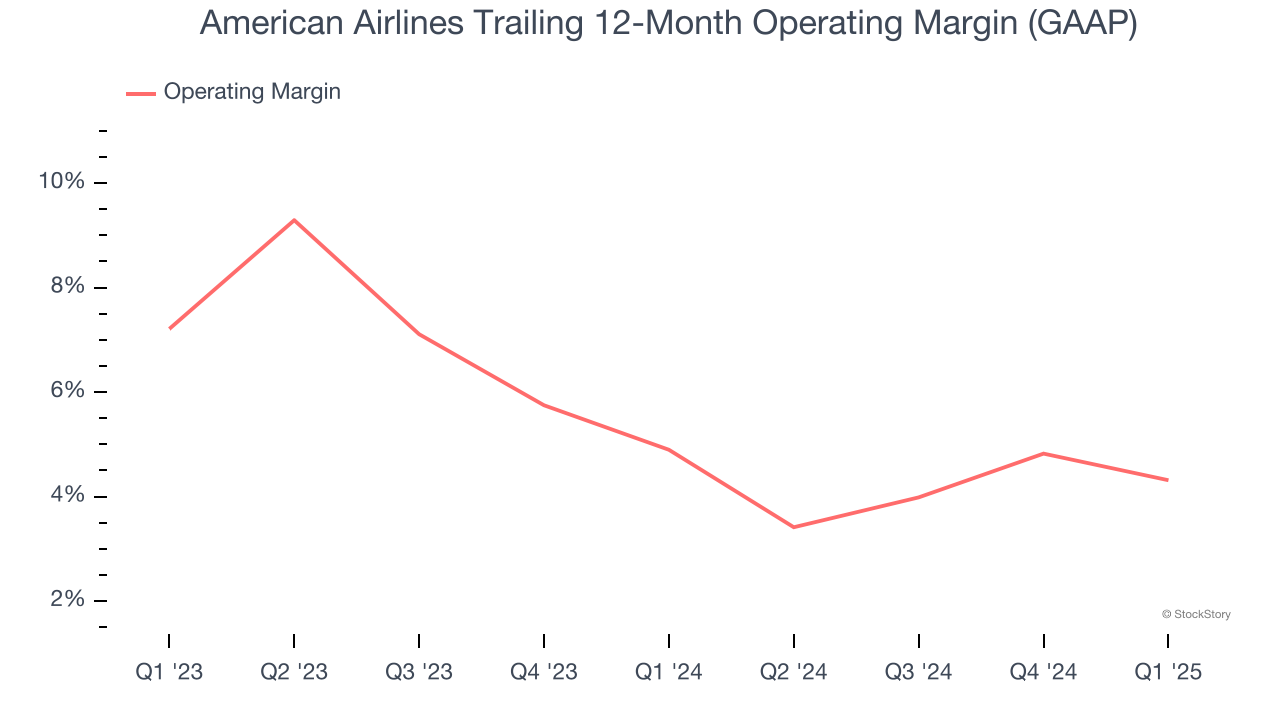
This quarter, American Airlines generated an operating profit margin of negative 2.2%, down 2.2 percentage points year on year. This contraction shows it was less efficient because its expenses increased relative to its revenue.
Looking ahead, Wall Street expects American Airlines to maintain its trailing 12-month operating margin of 4.3% in the coming year.
Earnings Per Share
Revenue trends explain a company’s historical growth, but the long-term change in earnings per share (EPS) points to the profitability of that growth – for example, a company could inflate its sales through excessive spending on advertising and promotions.
Sadly for American Airlines, its EPS declined by 1.2% annually over the last five years while its revenue grew by 4.4%. However, its operating margin actually expanded during this time, telling us that non-fundamental factors such as interest expenses and taxes affected its ultimate earnings.
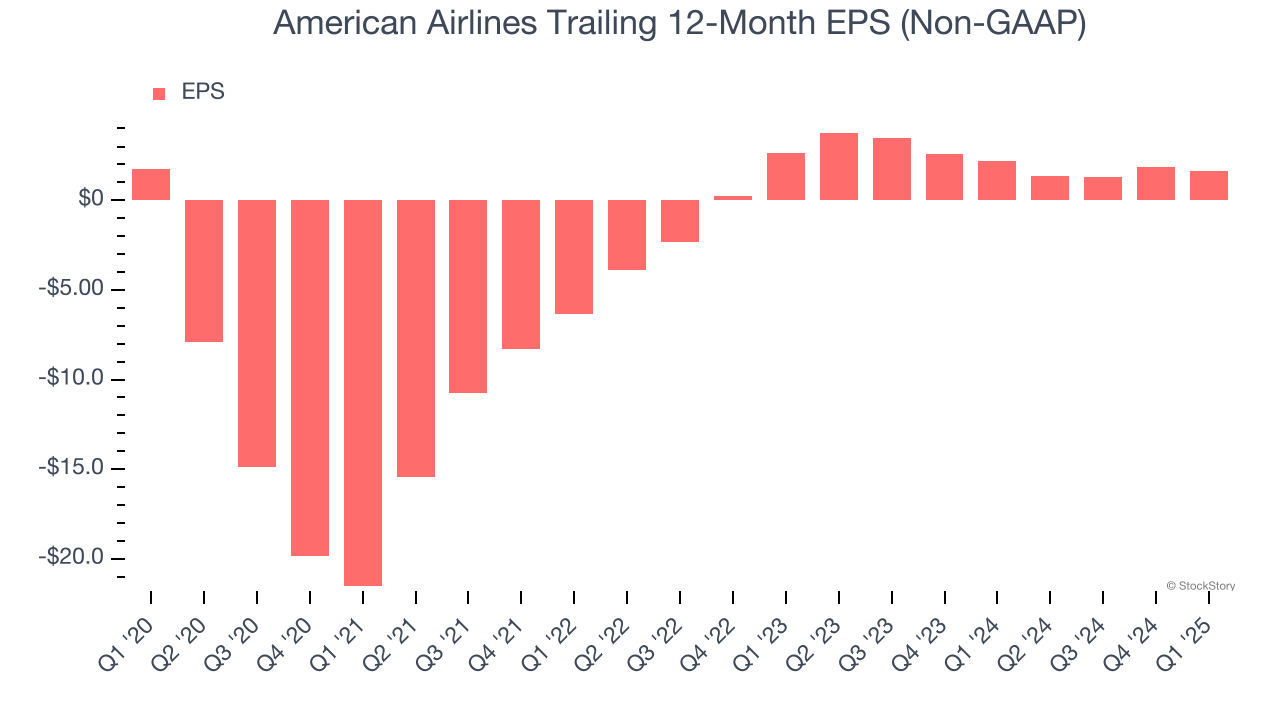
In Q1, American Airlines reported EPS at negative $0.59, down from negative $0.34 in the same quarter last year. Despite falling year on year, this print easily cleared analysts’ estimates. Over the next 12 months, Wall Street expects American Airlines’s full-year EPS of $1.64 to shrink by 8.7%.
Key Takeaways from American Airlines’s Q1 Results
It was encouraging to see American Airlines beat analysts’ EPS expectations this quarter. On the other hand, its EPS guidance for next quarter fell short of Wall Street’s estimates. Overall, this was a mixed quarter. The stock remained flat at $9.26 immediately following the results.
American Airlines underperformed this quarter, but does that create an opportunity to invest right now? We think that the latest quarter is only one piece of the longer-term business quality puzzle. Quality, when combined with valuation, can help determine if the stock is a buy. We cover that in our actionable full research report which you can read here, it’s free.


