
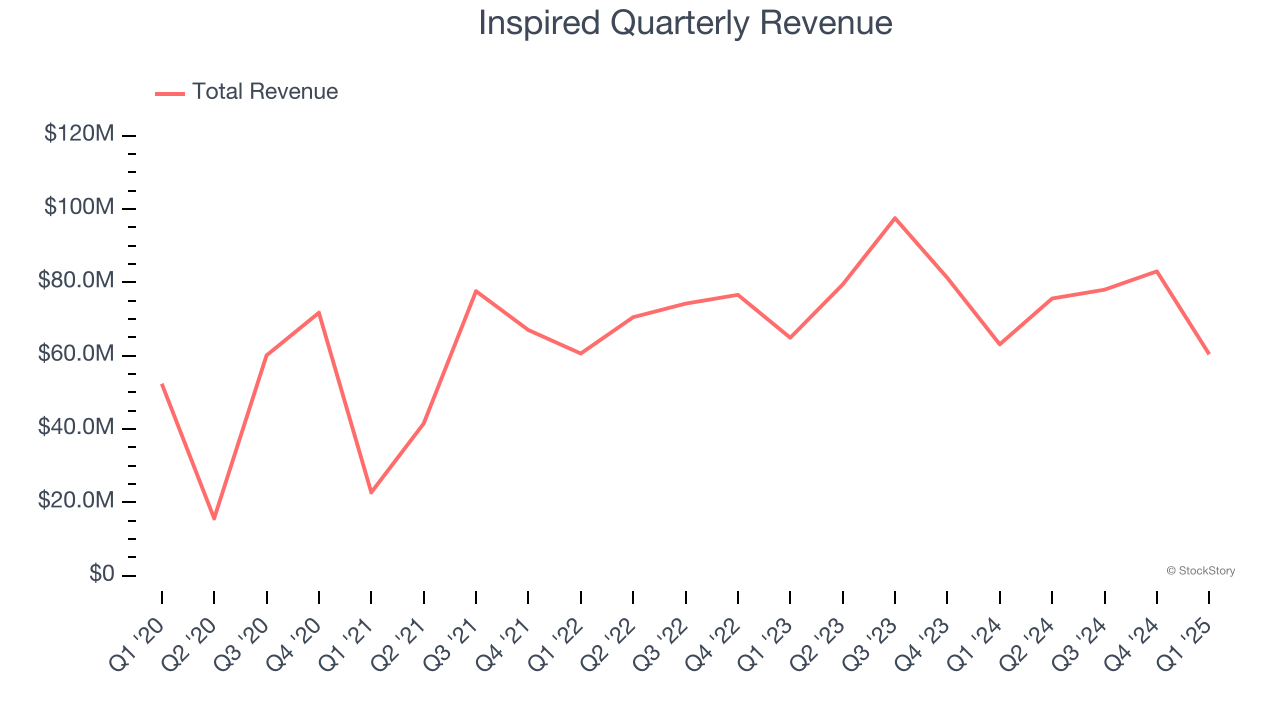
Gaming company Inspired (NASDAQ: INSE) fell short of the market’s revenue expectations in Q1 CY2025, with sales falling 4.3% year on year to $60.4 million. Its non-GAAP profit of $0.13 per share was significantly above analysts’ consensus estimates.
Is now the time to buy Inspired? Find out by accessing our full research report, it’s free.
Inspired (INSE) Q1 CY2025 Highlights:
- Revenue: $60.4 million vs analyst estimates of $67.11 million (4.3% year-on-year decline, 10% miss)
- Adjusted EPS: $0.13 vs analyst estimates of -$0.16 (significant beat)
- Adjusted EBITDA: $18.4 million vs analyst estimates of $19.4 million (30.5% margin, 5.2% miss)
- Operating Margin: 2.6%, up from -2.2% in the same quarter last year
- Free Cash Flow was $14.2 million, up from -$4.1 million in the same quarter last year
- Market Capitalization: $201 million
“We are pleased to report a strong start to 2025, reflecting the continued momentum across our diversified business segments,” said Lorne Weil, Executive Chairman of Inspired.
Company Overview
Specializing in digital casino gaming, Inspired (NASDAQ: INSE) is a provider of gaming hardware, virtual sports platforms, and server-based gaming systems.
Sales Growth
A company’s long-term sales performance is one signal of its overall quality. Any business can put up a good quarter or two, but the best consistently grow over the long haul. Over the last five years, Inspired grew its sales at a 11.5% compounded annual growth rate. Although this growth is acceptable on an absolute basis, it fell short of our standards for the consumer discretionary sector, which enjoys a number of secular tailwinds.
Long-term growth is the most important, but within consumer discretionary, product cycles are short and revenue can be hit-driven due to rapidly changing trends and consumer preferences. Inspired’s recent performance shows its demand has slowed as its annualized revenue growth of 1.9% over the last two years was below its five-year trend. 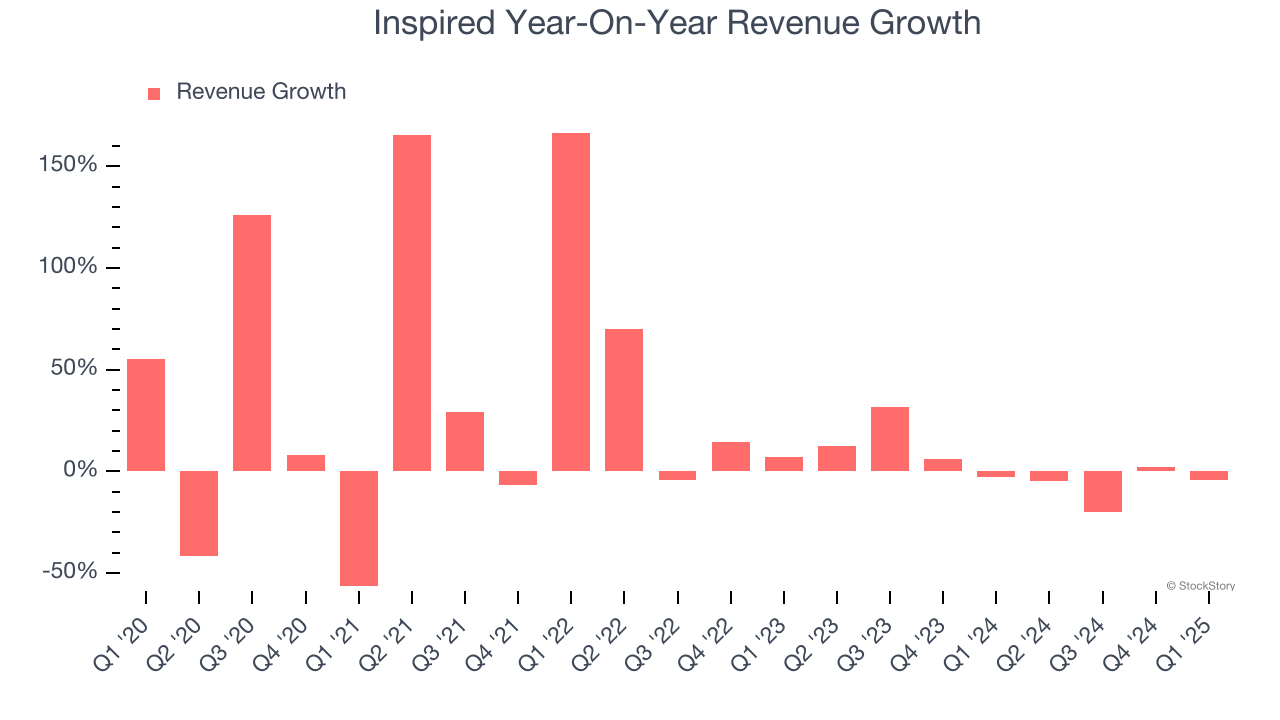
Inspired also breaks out the revenue for its three most important segments: Gaming, Leisure, and Virtual Sports, which are 35.9%, 14.4%, and 29.6% of revenue. Over the last two years, Inspired’s Gaming revenue (land-based casino games) averaged 4.3% year-on-year growth while its Leisure (gaming terminals and amusement machines) and Virtual Sports (digital gaming and sports betting) revenues averaged declines of 1.8% and 5.3%.
This quarter, Inspired missed Wall Street’s estimates and reported a rather uninspiring 4.3% year-on-year revenue decline, generating $60.4 million of revenue.
Looking ahead, sell-side analysts expect revenue to grow 3.1% over the next 12 months, similar to its two-year rate. Although this projection implies its newer products and services will fuel better top-line performance, it is still below the sector average.
Software is eating the world and there is virtually no industry left that has been untouched by it. That drives increasing demand for tools helping software developers do their jobs, whether it be monitoring critical cloud infrastructure, integrating audio and video functionality, or ensuring smooth content streaming. Click here to access a free report on our 3 favorite stocks to play this generational megatrend.
Operating Margin
Inspired’s operating margin has risen over the last 12 months and averaged 11.1% over the last two years. Its profitability was higher than the broader consumer discretionary sector, showing it did a decent job managing its expenses.
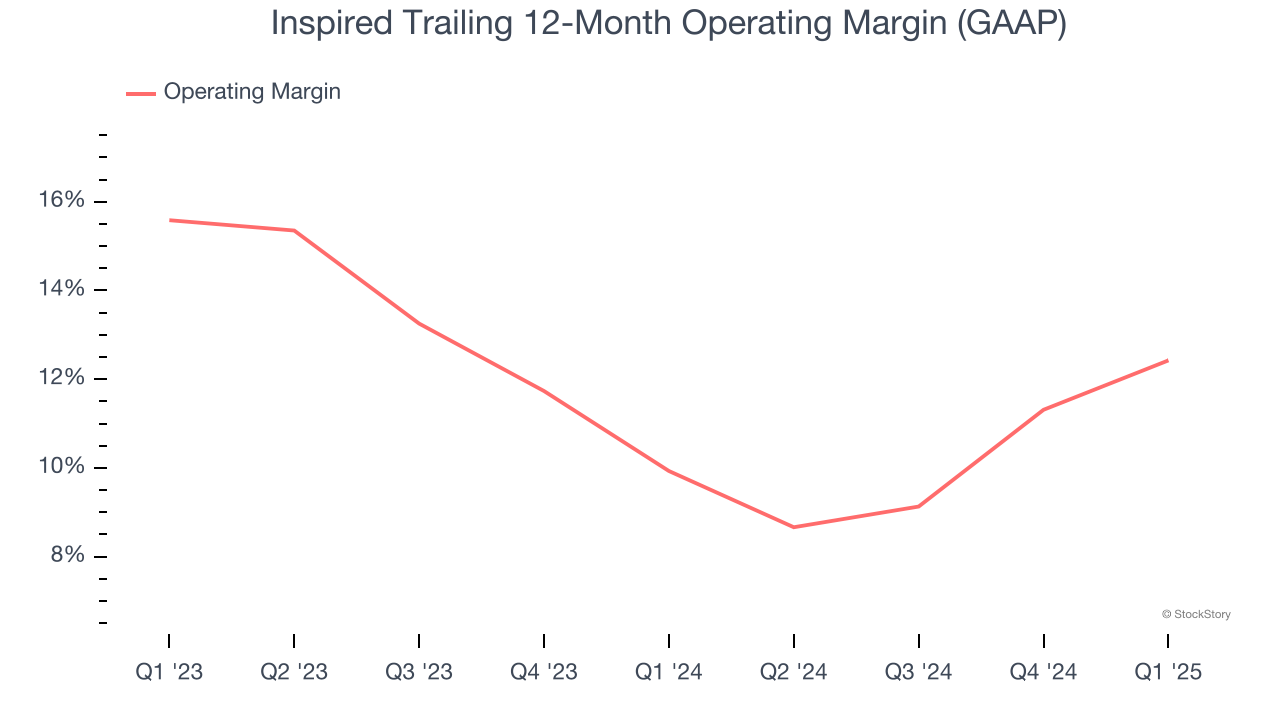
This quarter, Inspired generated an operating profit margin of 2.6%, up 4.9 percentage points year on year. This increase was a welcome development, especially since its revenue fell, showing it was more efficient because it scaled down its expenses.
Earnings Per Share
We track the long-term change in earnings per share (EPS) for the same reason as long-term revenue growth. Compared to revenue, however, EPS highlights whether a company’s growth is profitable.
Inspired’s full-year EPS flipped from negative to positive over the last five years. This is encouraging and shows it’s at a critical moment in its life.
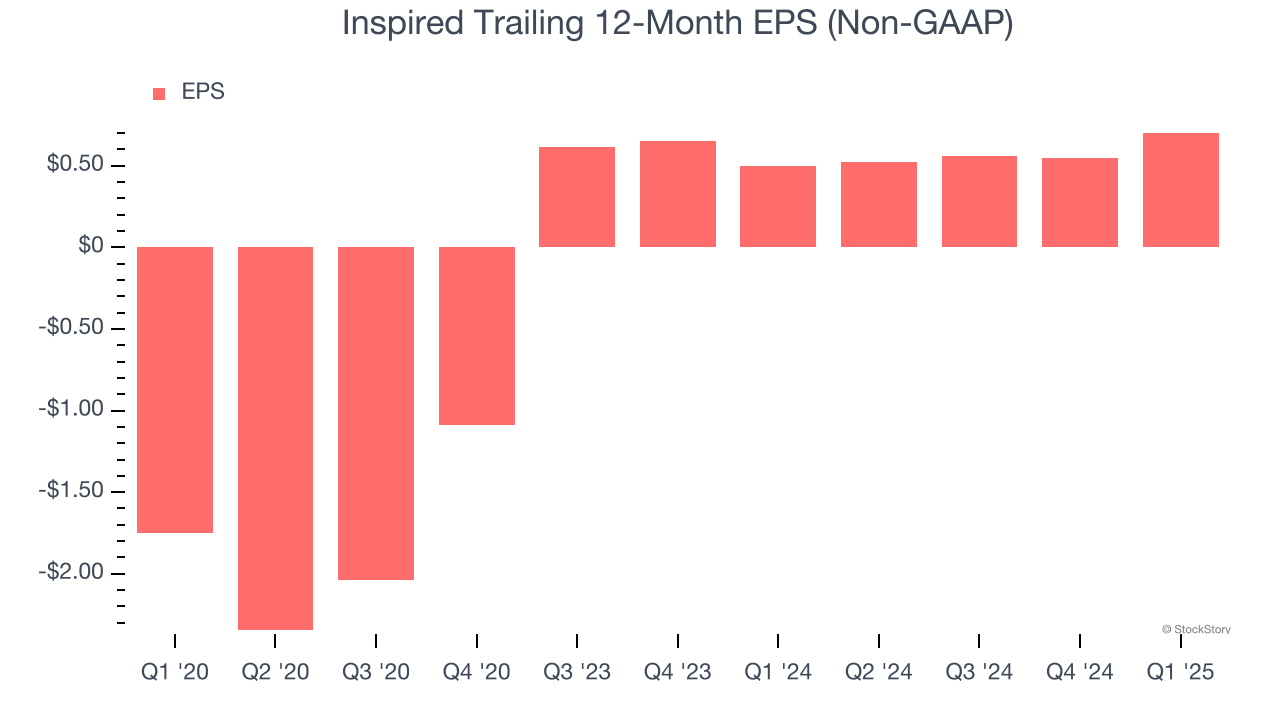
In Q1, Inspired reported EPS at $0.13, up from negative $0.02 in the same quarter last year. This print easily cleared analysts’ estimates, and shareholders should be content with the results. We also like to analyze expected EPS growth based on Wall Street analysts’ consensus projections, but there is insufficient data.
Key Takeaways from Inspired’s Q1 Results
We were impressed by how significantly Inspired blew past analysts’ EPS expectations this quarter. On the other hand, its revenue and EBITDA fell short of Wall Street’s estimates. Overall, this was a weaker quarter. The stock remained flat at $7.45 immediately after reporting.
Big picture, is Inspired a buy here and now? The latest quarter does matter, but not nearly as much as longer-term fundamentals and valuation, when deciding if the stock is a buy. We cover that in our actionable full research report which you can read here, it’s free.


