
Hotel franchising company Wyndham (NYSE: WH) reported Q2 CY2025 results exceeding the market’s revenue expectations, with sales up 8.2% year on year to $397 million. Its non-GAAP profit of $1.33 per share was 14.2% above analysts’ consensus estimates.
Is now the time to buy Wyndham? Find out by accessing our full research report, it’s free.
Wyndham (WH) Q2 CY2025 Highlights:
- Revenue: $397 million vs analyst estimates of $387.3 million (8.2% year-on-year growth, 2.5% beat)
- Adjusted EPS: $1.33 vs analyst estimates of $1.16 (14.2% beat)
- Adjusted EBITDA: $145 million vs analyst estimates of $184.8 million (36.5% margin, 21.5% miss)
- Management slightly raised its full-year Adjusted EPS guidance to $4.69 at the midpoint
- EBITDA guidance for the full year is $737.5 million at the midpoint, in line with analyst expectations
- Operating Margin: 37.8%, down from 39.5% in the same quarter last year
- Free Cash Flow was $81 million, up from -$6 million in the same quarter last year
- RevPAR: $47.55 at quarter end, up 3.4% year on year
- Market Capitalization: $6.77 billion
"We delivered another solid quarter growing our global system by 4%, expanding our development pipeline by 5%, increasing our ancillary revenues by 19%, and continuing to execute our strategy focused on higher FeePAR segments and markets, which is driving growth in both domestic and international royalty rates," said Geoff Ballotti, president and CEO.
Company Overview
Established in 1981, Wyndham (NYSE: WH) is a global hotel franchising company with over 9,000 hotels across nearly 95 countries on six continents.
Revenue Growth
Examining a company’s long-term performance can provide clues about its quality. Any business can experience short-term success, but top-performing ones enjoy sustained growth for years. Wyndham’s demand was weak over the last five years as its sales fell at a 3.4% annual rate. This was below our standards and is a sign of poor business quality.
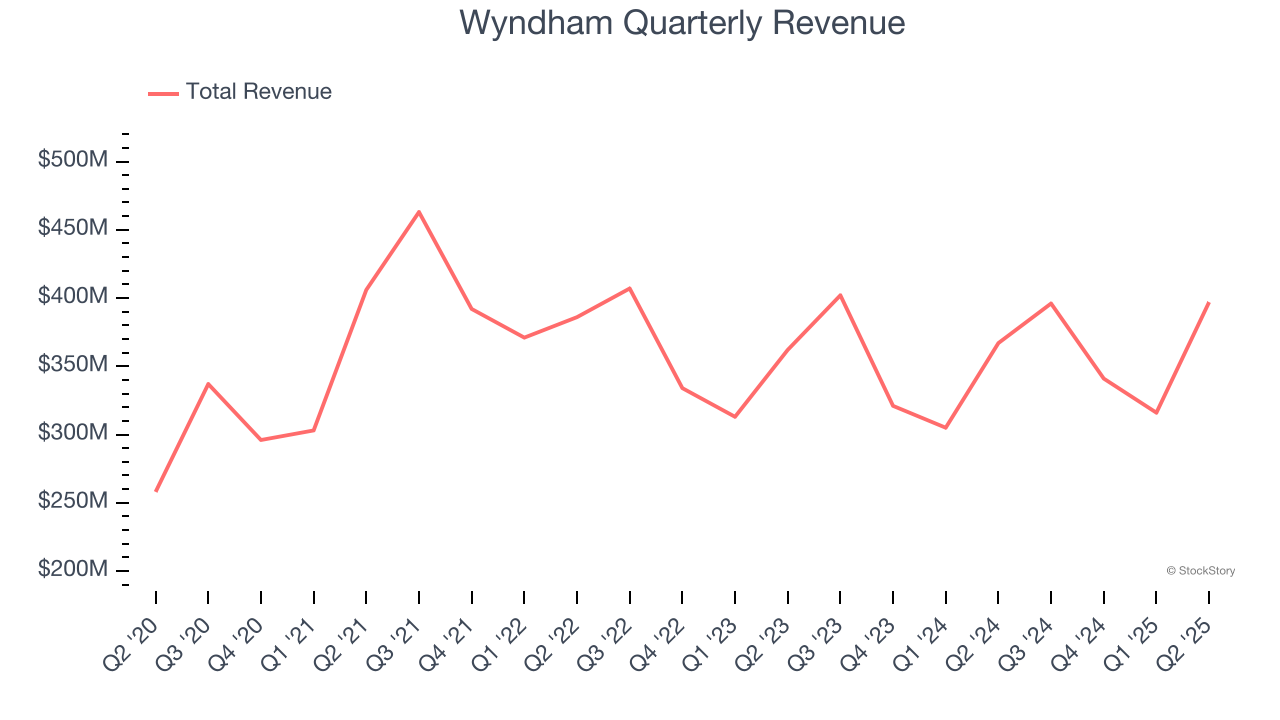
We at StockStory place the most emphasis on long-term growth, but within consumer discretionary, a stretched historical view may miss a company riding a successful new property or trend. Wyndham’s annualized revenue growth of 1.2% over the last two years is above its five-year trend, but we were still disappointed by the results. 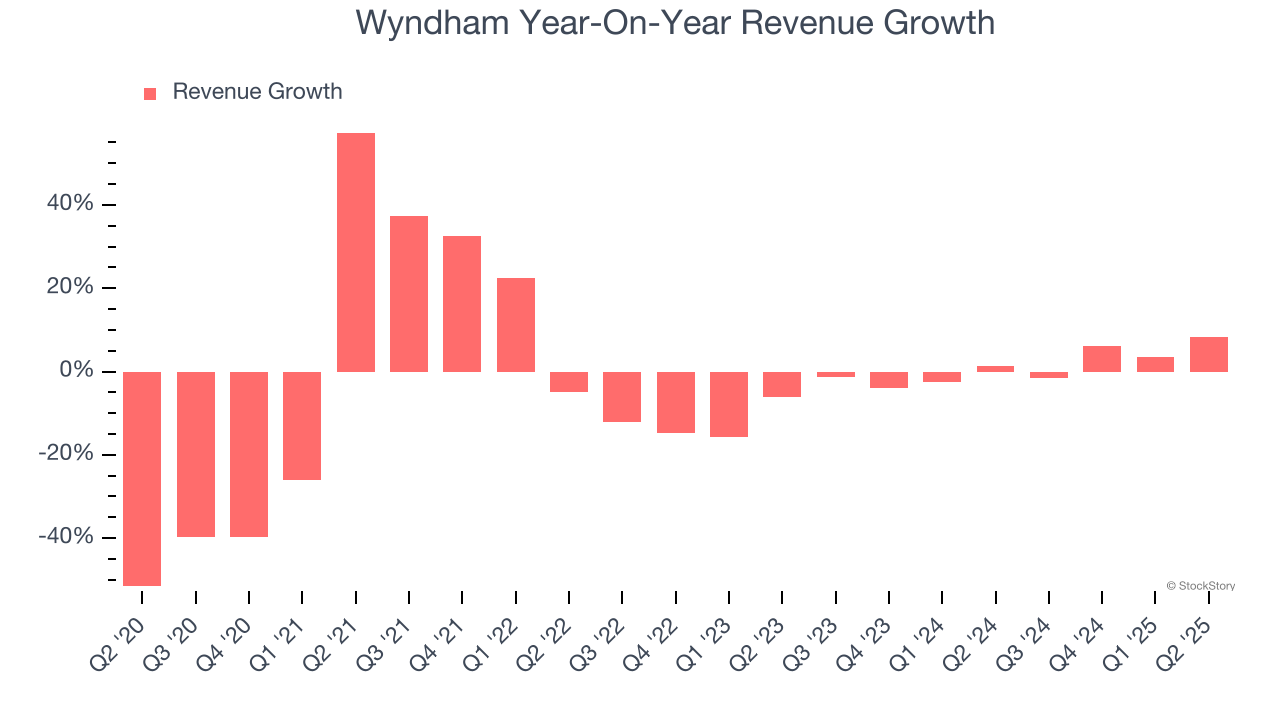
We can dig further into the company’s revenue dynamics by analyzing its revenue per available room, which clocked in at $47.55 this quarter and is a key metric accounting for daily rates and occupancy levels. Over the last two years, Wyndham’s revenue per room was flat. This number doesn’t surprise us as it’s in line with its revenue growth. 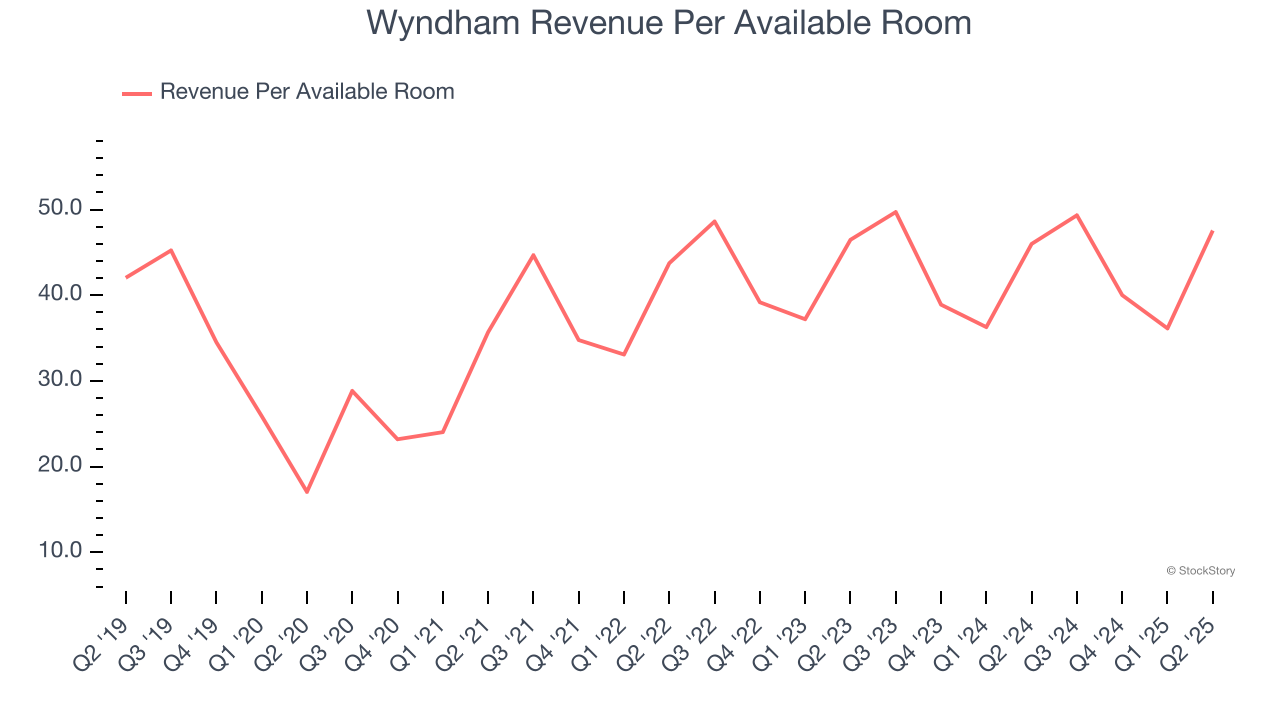
This quarter, Wyndham reported year-on-year revenue growth of 8.2%, and its $397 million of revenue exceeded Wall Street’s estimates by 2.5%.
Looking ahead, sell-side analysts expect revenue to grow 3.4% over the next 12 months. While this projection suggests its newer products and services will spur better top-line performance, it is still below average for the sector.
Here at StockStory, we certainly understand the potential of thematic investing. Diverse winners from Microsoft (MSFT) to Alphabet (GOOG), Coca-Cola (KO) to Monster Beverage (MNST) could all have been identified as promising growth stories with a megatrend driving the growth. So, in that spirit, we’ve identified a relatively under-the-radar profitable growth stock benefiting from the rise of AI, available to you FREE via this link.
Operating Margin
Wyndham’s operating margin has risen over the last 12 months and averaged 36% over the last two years. On top of that, its profitability was elite for a consumer discretionary business thanks to its efficient cost structure and economies of scale.
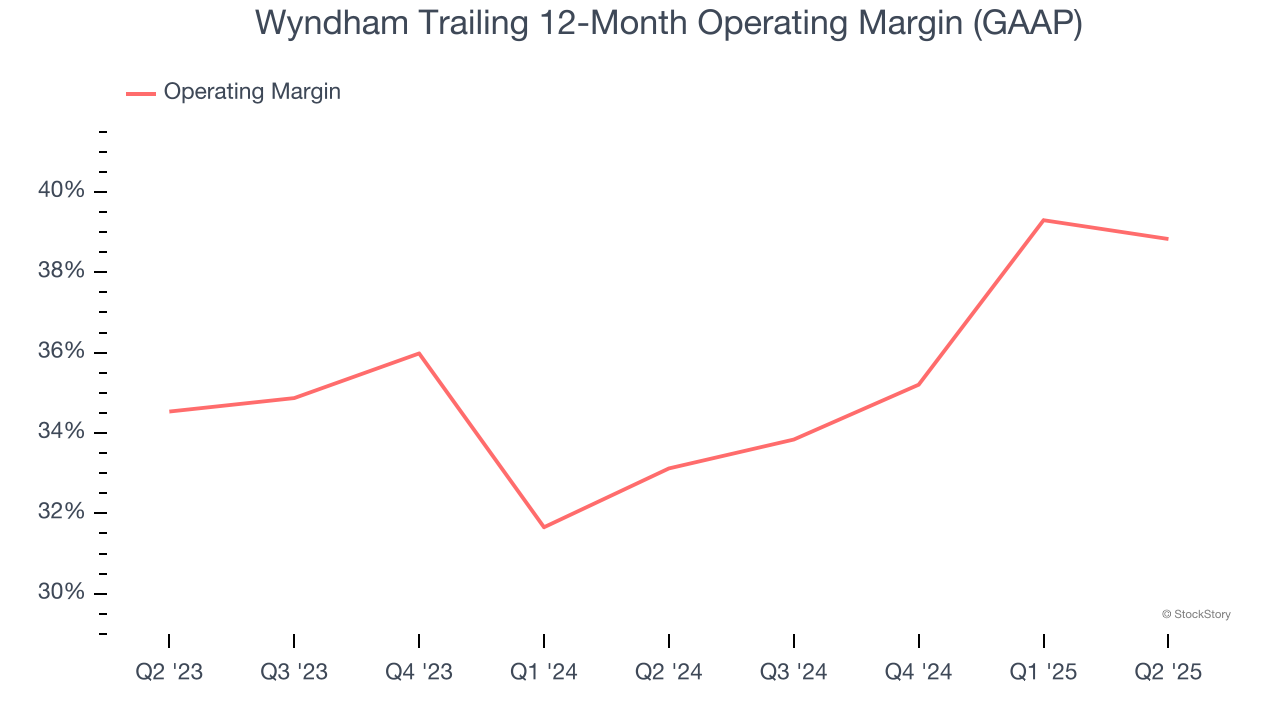
This quarter, Wyndham generated an operating margin profit margin of 37.8%, down 1.7 percentage points year on year. This reduction is quite minuscule and indicates the company’s overall cost structure has been relatively stable.
Earnings Per Share
Revenue trends explain a company’s historical growth, but the long-term change in earnings per share (EPS) points to the profitability of that growth – for example, a company could inflate its sales through excessive spending on advertising and promotions.
Wyndham’s EPS grew at a decent 13% compounded annual growth rate over the last five years, higher than its 3.4% annualized revenue declines. This tells us management adapted its cost structure in response to a challenging demand environment.
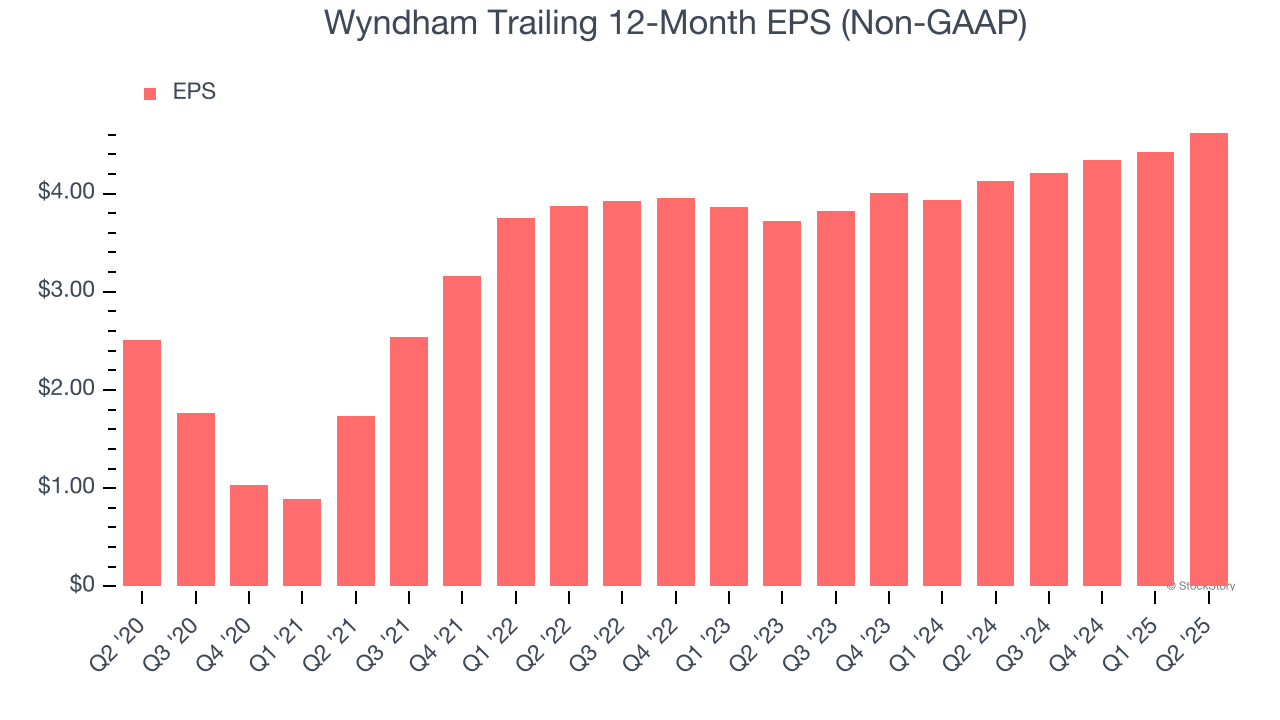
In Q2, Wyndham reported EPS at $1.33, up from $1.13 in the same quarter last year. This print easily cleared analysts’ estimates, and shareholders should be content with the results. Over the next 12 months, Wall Street expects Wyndham’s full-year EPS of $4.62 to grow 7.1%.
Key Takeaways from Wyndham’s Q2 Results
It was encouraging to see Wyndham beat analysts’ EPS expectations this quarter and raise its full-year EPS guidance. We were also happy its revenue outperformed Wall Street’s estimates. On the other hand, its EBITDA missed. Overall, this was a solid quarter. The stock traded up 4.3% to $89.82 immediately following the results.
Is Wyndham an attractive investment opportunity right now? When making that decision, it’s important to consider its valuation, business qualities, as well as what has happened in the latest quarter. We cover that in our actionable full research report which you can read here, it’s free.


