Landscaping service company BrightView (NYSE: BV) reported revenue ahead of Wall Streets expectations in Q4 CY2025, with sales up 2.6% year on year to $614.7 million. The company expects the full year’s revenue to be around $2.7 billion, close to analysts’ estimates. Its non-GAAP loss of $0.01 per share was $0.02 below analysts’ consensus estimates.
Is now the time to buy BrightView? Find out by accessing our full research report, it’s free.
BrightView (BV) Q4 CY2025 Highlights:
- Revenue: $614.7 million vs analyst estimates of $589.6 million (2.6% year-on-year growth, 4.2% beat)
- Adjusted EPS: -$0.01 vs analyst estimates of $0.01 ($0.02 miss)
- Adjusted EBITDA: $53.5 million vs analyst estimates of $55.39 million (8.7% margin, 3.4% miss)
- The company reconfirmed its revenue guidance for the full year of $2.7 billion at the midpoint
- EBITDA guidance for the full year is $370 million at the midpoint, in line with analyst expectations
- Operating Margin: -1.2%, down from -0.1% in the same quarter last year
- Free Cash Flow was -$18.6 million, down from $4.4 million in the same quarter last year
- Market Capitalization: $1.30 billion
Company Overview
An official field consultant for Major League Baseball, BrightView (NYSE: BV) offers landscaping design, development, and maintenance.
Revenue Growth
A company’s long-term performance is an indicator of its overall quality. Any business can experience short-term success, but top-performing ones enjoy sustained growth for years. Over the last five years, BrightView grew its sales at a sluggish 2.9% compounded annual growth rate. This was below our standards and is a tough starting point for our analysis.
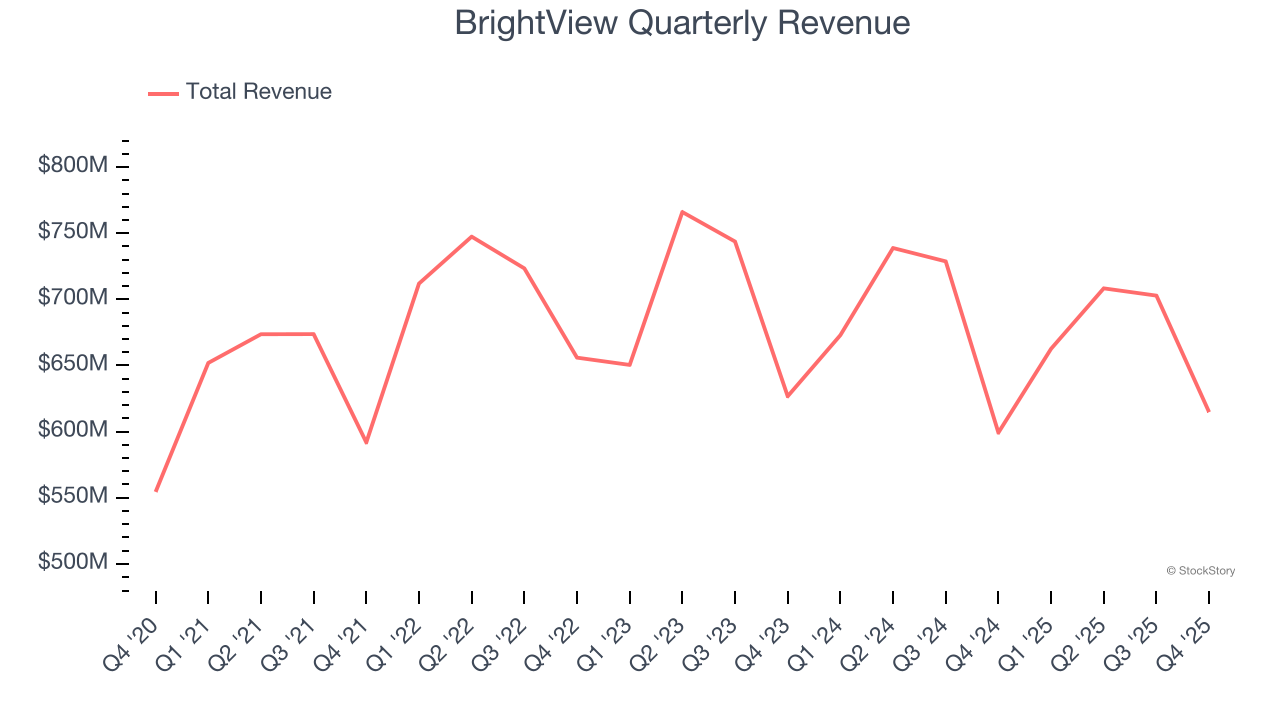
We at StockStory place the most emphasis on long-term growth, but within industrials, a half-decade historical view may miss cycles, industry trends, or a company capitalizing on catalysts such as a new contract win or a successful product line. BrightView’s performance shows it grew in the past but relinquished its gains over the last two years, as its revenue fell by 1.8% annually. 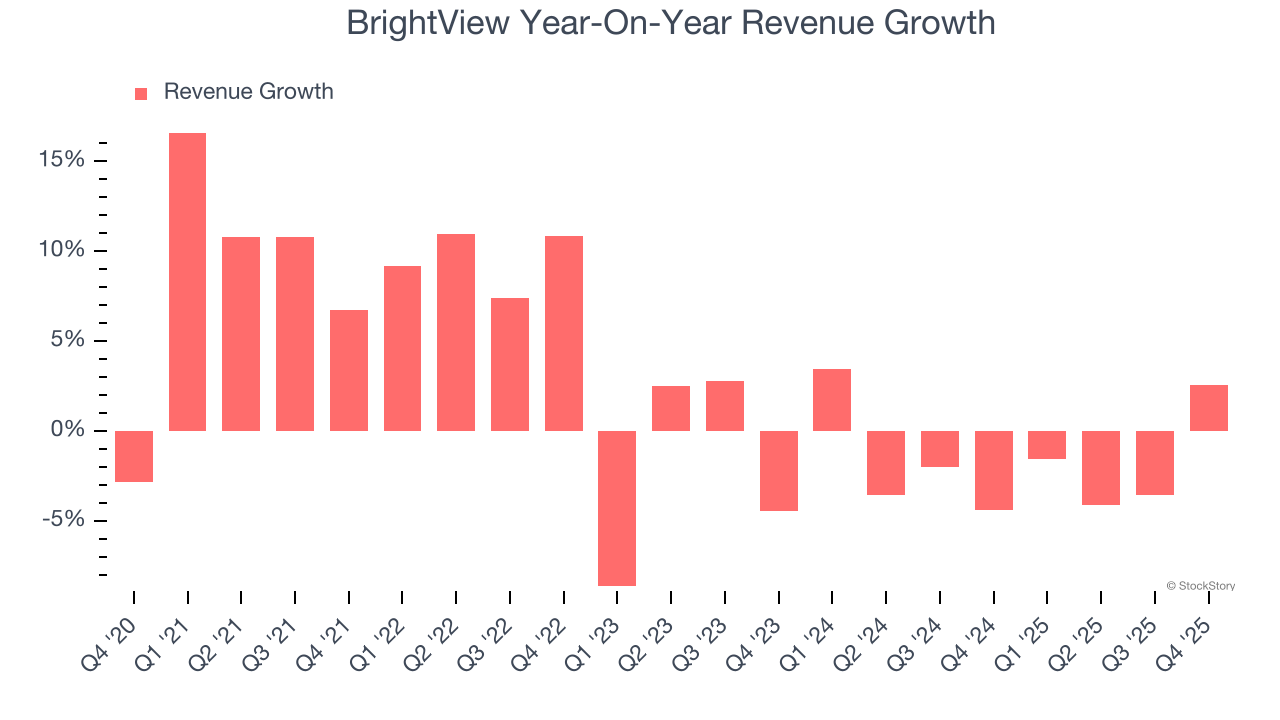
This quarter, BrightView reported modest year-on-year revenue growth of 2.6% but beat Wall Street’s estimates by 4.2%.
Looking ahead, sell-side analysts expect revenue to remain flat over the next 12 months. While this projection implies its newer products and services will catalyze better top-line performance, it is still below the sector average.
Software is eating the world and there is virtually no industry left that has been untouched by it. That drives increasing demand for tools helping software developers do their jobs, whether it be monitoring critical cloud infrastructure, integrating audio and video functionality, or ensuring smooth content streaming. Click here to access a free report on our 3 favorite stocks to play this generational megatrend.
Operating Margin
BrightView was profitable over the last five years but held back by its large cost base. Its average operating margin of 4.2% was weak for an industrials business. This result isn’t too surprising given its low gross margin as a starting point.
On the plus side, BrightView’s operating margin rose by 1.5 percentage points over the last five years, as its sales growth gave it operating leverage.
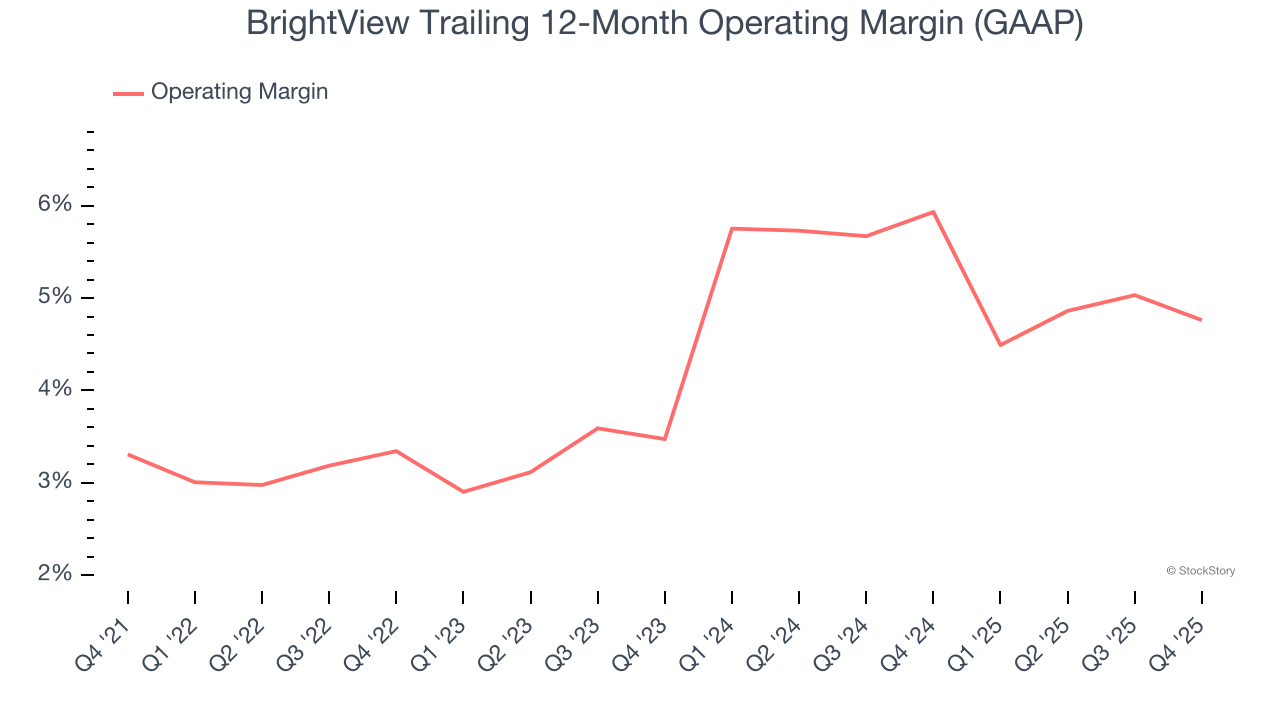
This quarter, BrightView generated an operating margin profit margin of negative 1.2%, down 1.1 percentage points year on year. Since BrightView’s gross margin decreased more than its operating margin, we can assume its recent inefficiencies were driven more by weaker leverage on its cost of sales rather than increased marketing, R&D, and administrative overhead expenses.
Earnings Per Share
We track the long-term change in earnings per share (EPS) for the same reason as long-term revenue growth. Compared to revenue, however, EPS highlights whether a company’s growth is profitable.
Sadly for BrightView, its EPS declined by 3.3% annually over the last five years while its revenue grew by 2.9%. We can see the difference stemmed from higher interest expenses or taxes as the company actually improved its operating margin and repurchased its shares during this time.
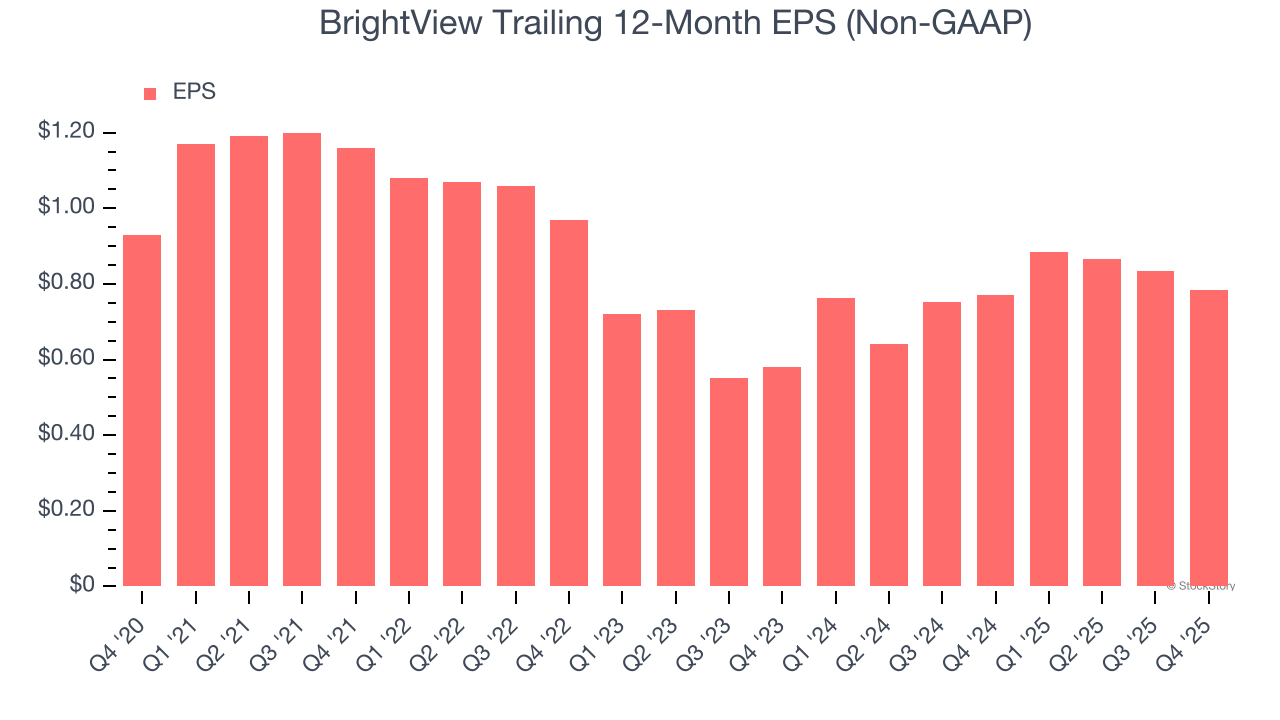
Like with revenue, we analyze EPS over a more recent period because it can provide insight into an emerging theme or development for the business.
For BrightView, its two-year annual EPS growth of 16.3% was higher than its five-year trend. This acceleration made it one of the faster-growing industrials companies in recent history.
In Q4, BrightView reported adjusted EPS of negative $0.01, down from $0.04 in the same quarter last year. This print missed analysts’ estimates. Over the next 12 months, Wall Street expects BrightView’s full-year EPS of $0.79 to shrink by 1.3%.
Key Takeaways from BrightView’s Q4 Results
We were impressed by how significantly BrightView blew past analysts’ revenue expectations this quarter. On the other hand, its EPS was in line and its EBITDA fell short of Wall Street’s estimates. Overall, this was a softer quarter. The stock traded down 1.5% to $13.45 immediately following the results.
BrightView’s latest earnings report disappointed. One quarter doesn’t define a company’s quality, so let’s explore whether the stock is a buy at the current price. What happened in the latest quarter matters, but not as much as longer-term business quality and valuation, when deciding whether to invest in this stock. We cover that in our actionable full research report which you can read here (it’s free).