Pet products provider Bark (NYSE: BARK) fell short of the markets revenue expectations in Q4 CY2025, with sales falling 22.1% year on year to $98.45 million. Its non-GAAP loss of $0.03 per share was $0.01 above analysts’ consensus estimates.
Is now the time to buy Bark? Find out by accessing our full research report, it’s free.
Bark (BARK) Q4 CY2025 Highlights:
- On January 14, 2026, the Company received a preliminary non-binding indicative proposal letter from GNK Holdings LLC and Marcus Lemonis (collectively, the “GNK/Lemonis Group”). The GNK/Lemonis Group letter proposes that the GNK/Lemonis Group would acquire all of the outstanding shares of the Company’s common stock not already beneficially owned by the GNK/Lemonis Group, in an all-cash transaction, for $1.10 per share.
- Revenue: $98.45 million vs analyst estimates of $102.7 million (22.1% year-on-year decline, 4.1% miss)
- Adjusted EPS: -$0.03 vs analyst estimates of -$0.04 ($0.01 beat)
- Adjusted EBITDA: -$1.61 million (-1.6% margin, 3.4% year-on-year decline)
- Operating Margin: -9.1%, in line with the same quarter last year
- Free Cash Flow was $1.56 million, up from -$1.96 million in the same quarter last year
- Market Capitalization: $143.8 million
Company Overview
Making a name for itself with the BarkBox, Bark (NYSE: BARK) specializes in subscription-based, personalized pet products.
Revenue Growth
A company’s long-term sales performance is one signal of its overall quality. Any business can experience short-term success, but top-performing ones enjoy sustained growth for years. Unfortunately, Bark’s 5.2% annualized revenue growth over the last five years was weak. This was below our standard for the consumer discretionary sector and is a poor baseline for our analysis.
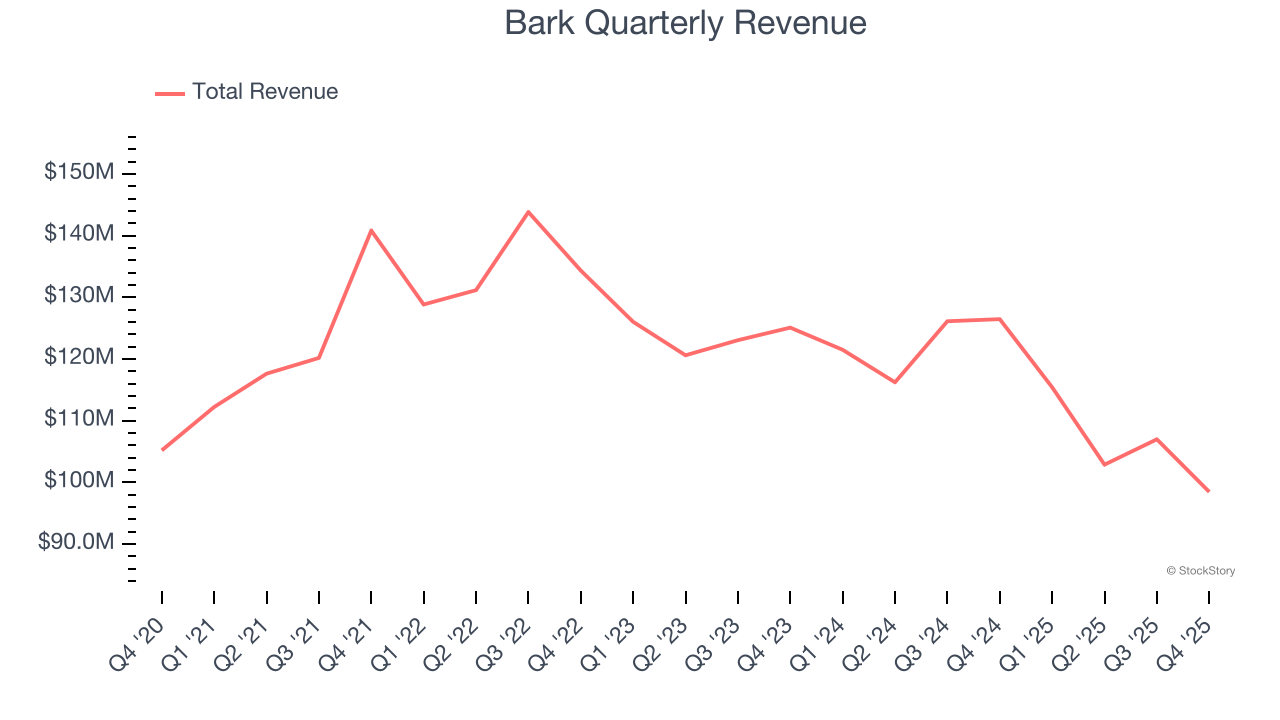
We at StockStory place the most emphasis on long-term growth, but within consumer discretionary, a stretched historical view may miss a company riding a successful new product or trend. Bark’s performance shows it grew in the past but relinquished its gains over the last two years, as its revenue fell by 7.5% annually. 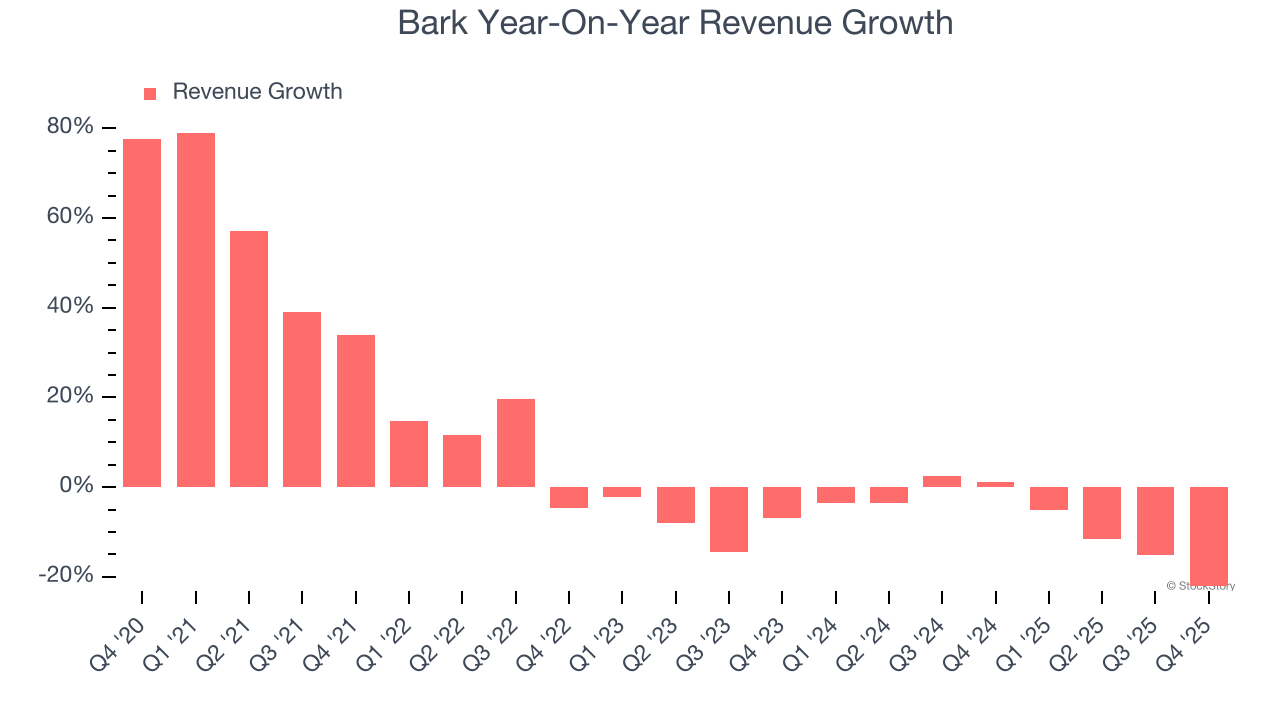
This quarter, Bark missed Wall Street’s estimates and reported a rather uninspiring 22.1% year-on-year revenue decline, generating $98.45 million of revenue.
Looking ahead, sell-side analysts expect revenue to remain flat over the next 12 months. Although this projection suggests its newer products and services will spur better top-line performance, it is still below the sector average.
While Wall Street chases Nvidia at all-time highs, an under-the-radar semiconductor supplier is dominating a critical AI component these giants can’t build without. Click here to access our free report one of our favorites growth stories.
Operating Margin
Operating margin is an important measure of profitability as it shows the portion of revenue left after accounting for all core expenses – everything from the cost of goods sold to advertising and wages. It’s also useful for comparing profitability across companies with different levels of debt and tax rates because it excludes interest and taxes.
Bark’s operating margin has shrunk over the last 12 months and averaged negative 7.6% over the last two years. Unprofitable consumer discretionary companies with falling margins deserve extra scrutiny because they’re spending loads of money to stay relevant, an unsustainable practice.
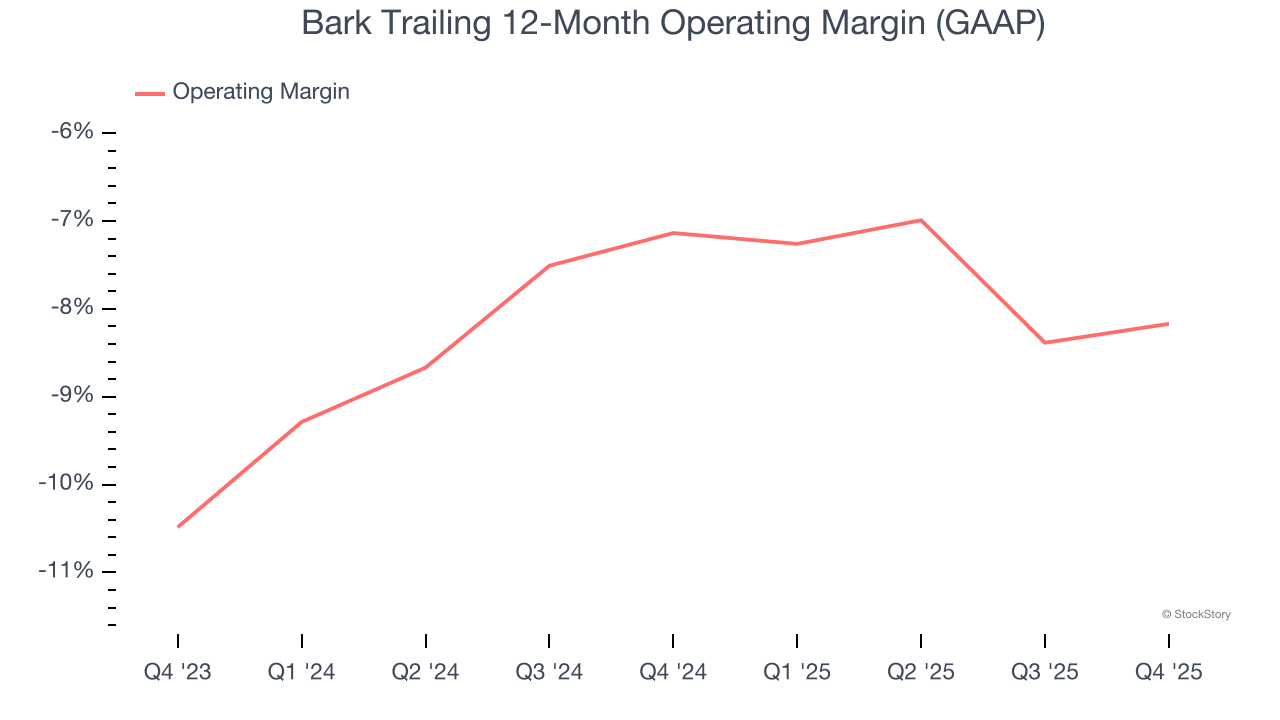
Bark’s operating margin was negative 9.1% this quarter. The company's consistent lack of profits raise a flag.
Earnings Per Share
We track the long-term change in earnings per share (EPS) for the same reason as long-term revenue growth. Compared to revenue, however, EPS highlights whether a company’s growth is profitable.
Although Bark’s full-year earnings are still negative, it reduced its losses and improved its EPS by 25% annually over the last four years. The next few quarters will be critical for assessing its long-term profitability.
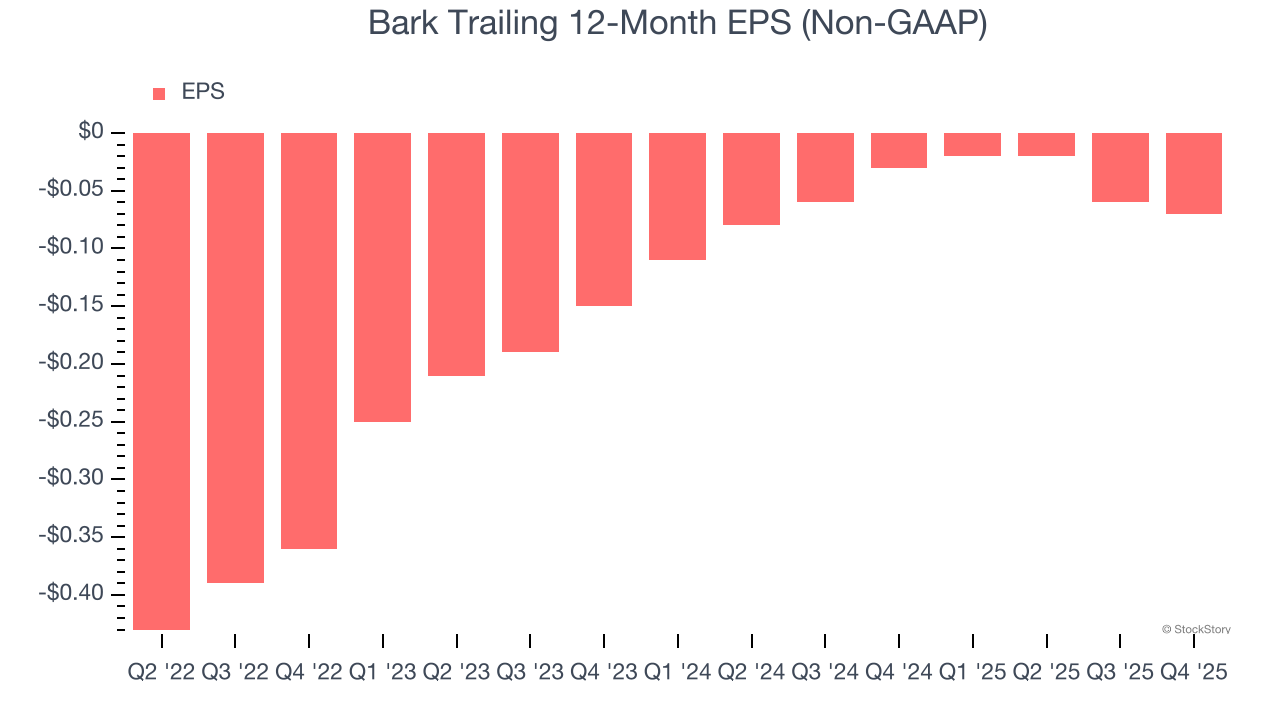
In Q4, Bark reported adjusted EPS of negative $0.03, down from negative $0.02 in the same quarter last year. Despite falling year on year, this print easily cleared analysts’ estimates. Over the next 12 months, Wall Street expects Bark to perform poorly. Analysts forecast its full-year EPS of negative $0.07 will tumble to negative $0.08.
Key Takeaways from Bark’s Q4 Results
We were impressed by how significantly Bark blew past analysts’ EBITDA expectations this quarter. We were also glad its EPS outperformed Wall Street’s estimates. On the other hand, its revenue missed. Overall, this print had some key positives. The stock remained flat at $0.82 immediately following the results.
On January 14, 2026, the Company received a preliminary non-binding indicative proposal letter from GNK Holdings LLC and Marcus Lemonis (collectively, the “GNK/Lemonis Group”). The GNK/Lemonis Group letter proposes that the GNK/Lemonis Group would acquire all of the outstanding shares of the Company’s common stock not already beneficially owned by the GNK/Lemonis Group, in an all-cash transaction, for $1.10 per share.
So should you invest in Bark right now? When making that decision, it’s important to consider its valuation, business qualities, as well as what has happened in the latest quarter. We cover that in our actionable full research report which you can read here (it’s free).