 Saved by the 50 DMA's!
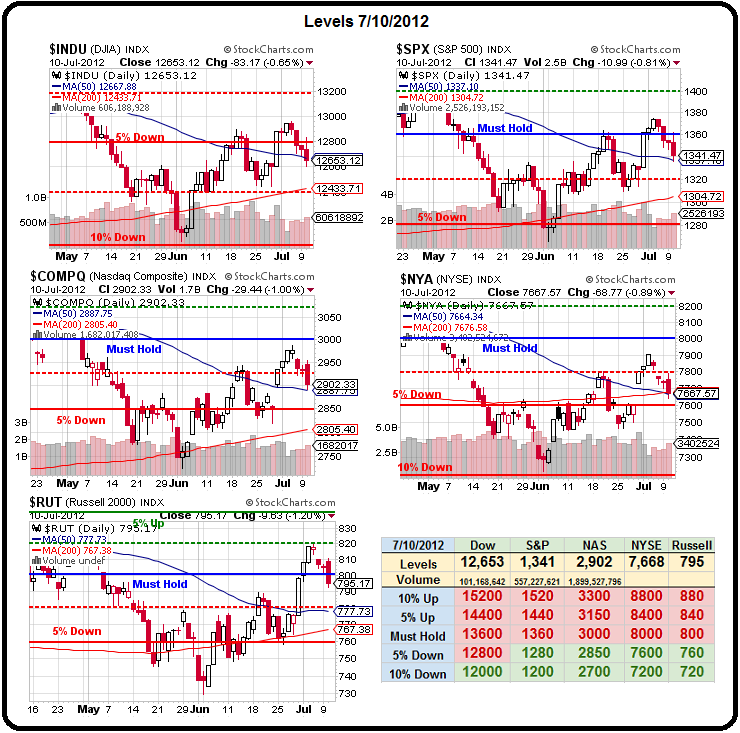
Who said investing is hard? 4 of our 5 major indexes fall in synch and stop dead at the 50 day moving average that we've been watching on our Big Chart for over two months now as bullish support. Yawn…
Of course, if you think this can possibly be result of individual decisions made by millions of global investors than it's you that need to wake up. This is a completely machine-driven market and that's a GOOD thing if you follow our charts, as they give you very clear indications of all the major inflection points.
I'm not at all a TA guy – I merely accept the fact that the markets are fixed and the moves are coordinated and we set our points accordingly according to our 5% Rule, which works best in Bot-driven markets. Since we only adjust our Big Chart once a year or less – it lets us dispense with all that TA BS in less than two minutes a day and move on to more important things like – FUNDAMENTALS!
 What we can do, however, is combine our view of the Big Chart with some fundamentals to figure out what the market will do at serious inflection points. Note on Dave Fry's SPY chart, we get a good view of the weak 50 dma.
Before we despair, however, look at that upwardly jammin' 200 dma – that sucker is going to pop the index like it was hit with a tennis racket at right about 1,320 in about 2 weeks so we have a jittery sell-off in a choppy early earnings season to look forward to and then something good happening at the end of the month to spark a rally.
Oh sorry, I planned to conclude with that but it's so freakin' obvious – why waste time with exposition?
Going back to the Big Chart, you can see on the S&P (and the others) that we still have a constructively bullish "M" pattern where the lows are lining up in an up-trend that mirrors the rising 200 dma. Obviously, if we fail to hold these 50 dmas – the next stop is that 200 DMA, which is generally intersecting the 2.5% lines on each index but forget those – it's all about the NYSE, which is our broadest index and is already testing its 200 dma AND…
