Now what? Options expire on Friday and last expiration day (4/18), we were 2.5% higher on the Russell and Nasdaq , which is about how much higher the Dow, S&P and NYSE are from where they were at the time . It's been an interesting month watching our indexes diverge but, as we discussed in our Tug Boat Example last week , this sort of behavoir simply doesn't last very long. The end of that discussion (last Thursday) was: NYSE 10,000 was clearly the right line and 10,500 is the 5% line and 10,750 is 7.5% with the NYSE now at 10,667. Another reason we don't move the Must Hold lines is the NYSE has given no indication at all that it will be able to go over 11,000 (10% line) and we're back the tugboat that holds the others back. RUT 1,100 is the 10% line and 1,200 is the 20% line and the RUT moves like the only thing trading it is a computer running on the 5% Rule. Complete obedience of the lines makes it fantastic to trade – except the direction it moves is quick and seemingly random! Still, 1,100 is a very good floor (so bullish above) and 1,200 has been too hard to hold (so short below) and, at the moment, it's fallen into the lowest quadrant of that range – not able to stay over 1,125. That indicates a downward bias as it makes a triangle squeezy thingy down there (and it's below the 200 dma at 1,115 at the moment). So, either the RUT comes out of the triangle squeezy thingy to the downside and drags the others with it or the Dow, NYSE and S&P pop over their resistance and bring the RUT along for the ride. Interesting times indeed… As you can see from Dave Fry's Russell Chart , the RUT resolved it's triangle sqeezy thingy to the downside – after the requisite head-fake and now we're back to the …
 Now what?
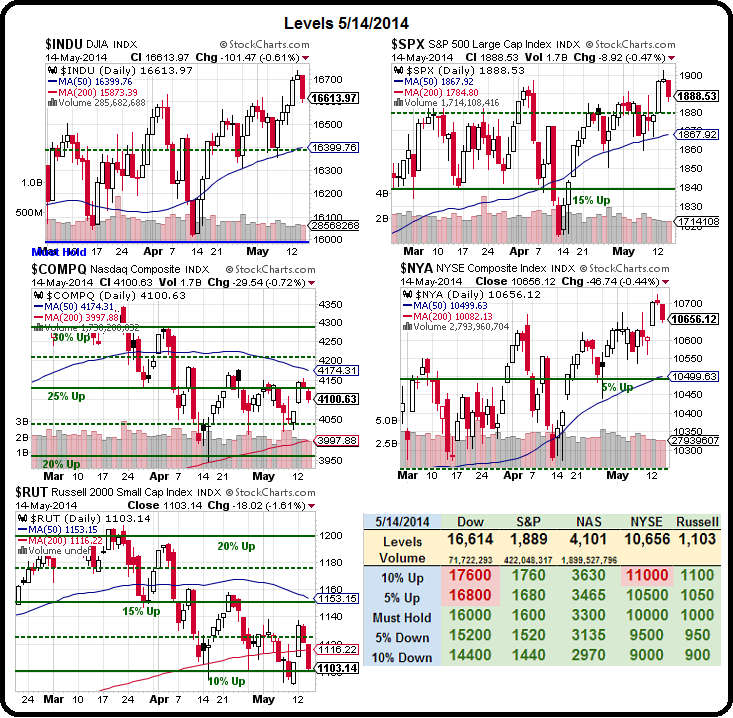
Options expire on Friday and last expiration day (4/18), we were 2.5% higher on the Russell and Nasdaq , which is about how much higher the Dow, S&P and NYSE are from where they were at the time.
It's been an interesting month watching our indexes diverge but, as we discussed in our Tug Boat Example last week, this sort of behavoir simply doesn't last very long. The end of that discussion (last Thursday) was:
NYSE 10,000 was clearly the right line and 10,500 is the 5% line and 10,750 is 7.5% with the NYSE now at 10,667. Another reason we don't move the Must Hold lines is the NYSE has given no indication at all that it will be able to go over 11,000 (10% line) and we're back the tugboat that holds the others back.
RUT 1,100 is the 10% line and 1,200 is the 20% line and the RUT moves like the only thing trading it is a computer running on the 5% Rule. Complete obedience of the lines makes it fantastic to trade – except the direction it moves is quick and seemingly random! Still, 1,100 is a very good floor (so bullish above) and 1,200 has been too hard to hold (so short below) and, at the moment, it's fallen into the lowest quadrant of that range – not able to stay over 1,125. That indicates a downward bias as it makes a triangle squeezy thingy down there (and it's below the 200 dma at 1,115 at the moment).
So, either the RUT comes out of the triangle squeezy thingy to the downside and drags the others with it or the Dow, NYSE and S&P pop over their resistance and bring the RUT along for the ride. Interesting times indeed…
 As you can see from Dave Fry's Russell Chart, the RUT resolved it's triangle sqeezy thingy to the downside – after the requisite head-fake and now we're back to the…

