Best Buy (BBY) is approaching a key resistance level. If this level is surpassed a breakout could occur.
BBY is one of the largest consumer electronics retailers in the U.S. Its stores provide computing and mobile phones, home theater products, gaming hardware and software as well as appliances such as dishwashers, ovens, refrigerators, and blenders.
The company is focused on accelerating online sales growth, improving its multichannel customer experience, and developing new in-store and in-home service offerings. While BBY saw increased demand for its products and services in the final quarter of 2020, management expects margins to decrease due to higher supply chain costs.
BBY had $5.5 billion in cash on hand as of the end of January. This compares to only $100 million in short-term debt. The company has seen steady earnings and revenue growth over the past year. Analysts expect sales to rise 24.1% year over year during the current quarter. Earnings are forecasted to surge 92.5% during the same time period.
BBY’s stock is currently undervalued with a trailing P/E of 17.66. Though the stock has been surging higher since early March. This has resulted in a Momentum Grade of A in our POWR Ratings system and represented in the chart below.
Take a look at the 1-year chart of BBY below with added notations:
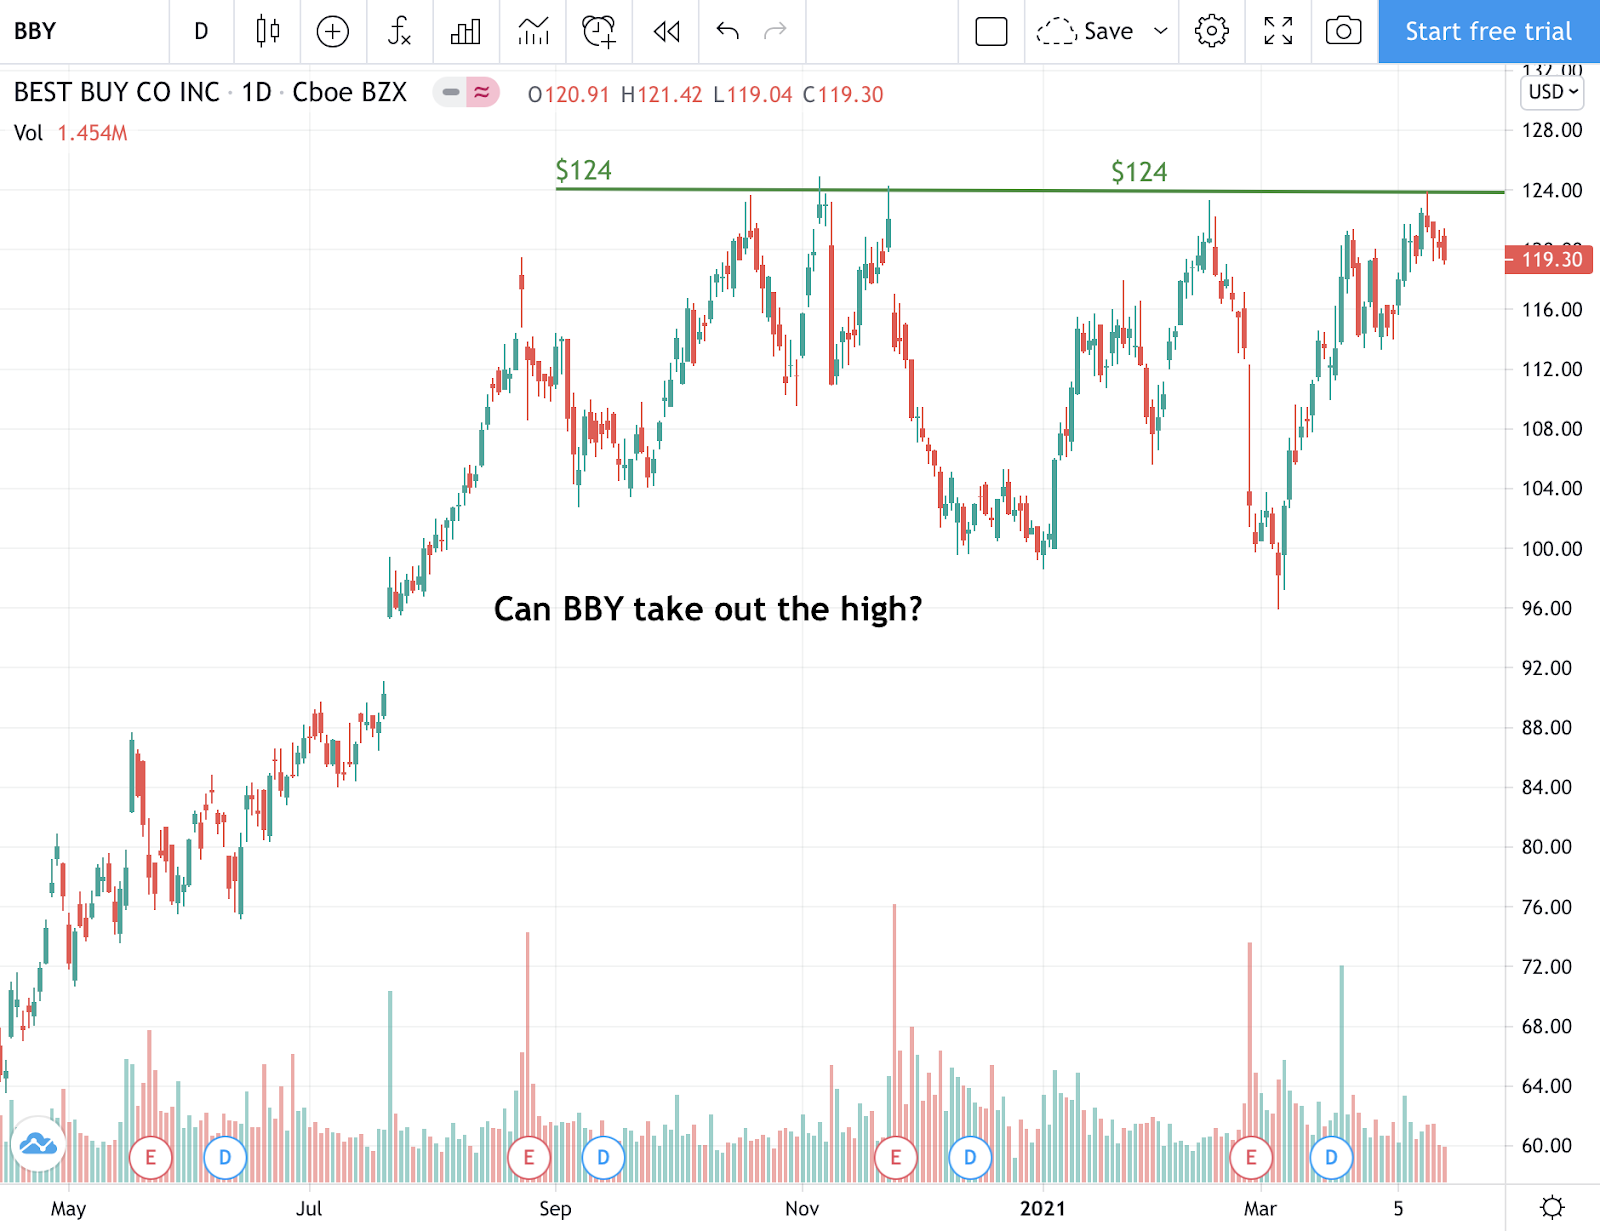
After falling to the $100 area again last month, BBY has rebounded and made its way back up towards its 52-week highs. The stock has recently stalled at the $124 resistance (green), just as it has done multiple times previously.
A solid close above that $124 area should lead to much higher prices for BBY. A possible long position on the stock would be on a breakout above the $124 level with a protective stop placed under it.
Want to Discover More Great Trades?
I have explored virtually every flavor of technical analysis and chart pattern known to mankind. The sad fact is that the vast majority of them don’t work at all.
That is why I recently put together this special report to help investors focus on the only 5 chart patterns that matter…the ones that lead to the most timely and profitable stock trades. Click below to get your copy now!
5 WINNING Stock Chart Patterns
Have a good trading day!
Good luck!
Christian Tharp, CMT
Want More Great Investing Ideas?
How to Ride the NEW Stock Bubble?
BBY shares rose $0.81 (+0.68%) in premarket trading Friday. Year-to-date, BBY has gained 20.29%, versus a 11.84% rise in the benchmark S&P 500 index during the same period.
About the Author: Christian Tharp

I am an expert stock market coach having helped over 4000 beginner and advanced traders & investors from around the world take control of their financial futures. I also write stock market related articles for the Adam Mesh Trading Group and Yolo Publishing.
The post Breakout in the Charts for Best Buy? appeared first on StockNews.com