Global home goods company Newell Brands Inc. (NWL) has anchored its operations on the design, manufacturing, sourcing, and distribution of consumer and commercial products on an international scale.
However, in the current context of a rising interest rate environment, NWL’s efforts to regain financial stability may encounter significant headwinds. Consequently, investing in the firm at this stage could present considerable risks. Hence, the stock might be best avoided now.
Moreover, its share value is currently trading below both its 50-day and 200-day averages of $9.23 and $12.67, respectively, signaling a downtrend. The company presents substantial challenges due to dwindling revenues and increasing financial debts.
In the fiscal first quarter ending March 31, 2023, NWL reported a 24.4% year-over-year reduction in net sales to $1.81 billion. Furthermore, its gross profit also took a hit, decreasing 34.9% compared to the same quarter of the previous year to $482 million. The company registered an operational loss of $36 million, a stark contrast to the $217 million income from the preceding yearly quarter. Also, NWL reported a net loss of $102 million, compared to a net gain of $228 million in the same quarter a year ago.
As the first fiscal quarter concluded, NWL’s cash reserves stood at $285 million, overshadowed by its towering debt of $5.36 billion. Moreover, the negative operating cash flows have cast doubts over its ability to service the colossal debt effectively. Operating cash outflow was $77 million.
Let’s analyze some of its key metrics that supports my bearish stance:
NWL’s Financial Performance: Analyzing Net Income, P/S Ratio, ROIC, Current Ratio, and Asset Turnover Ratio:
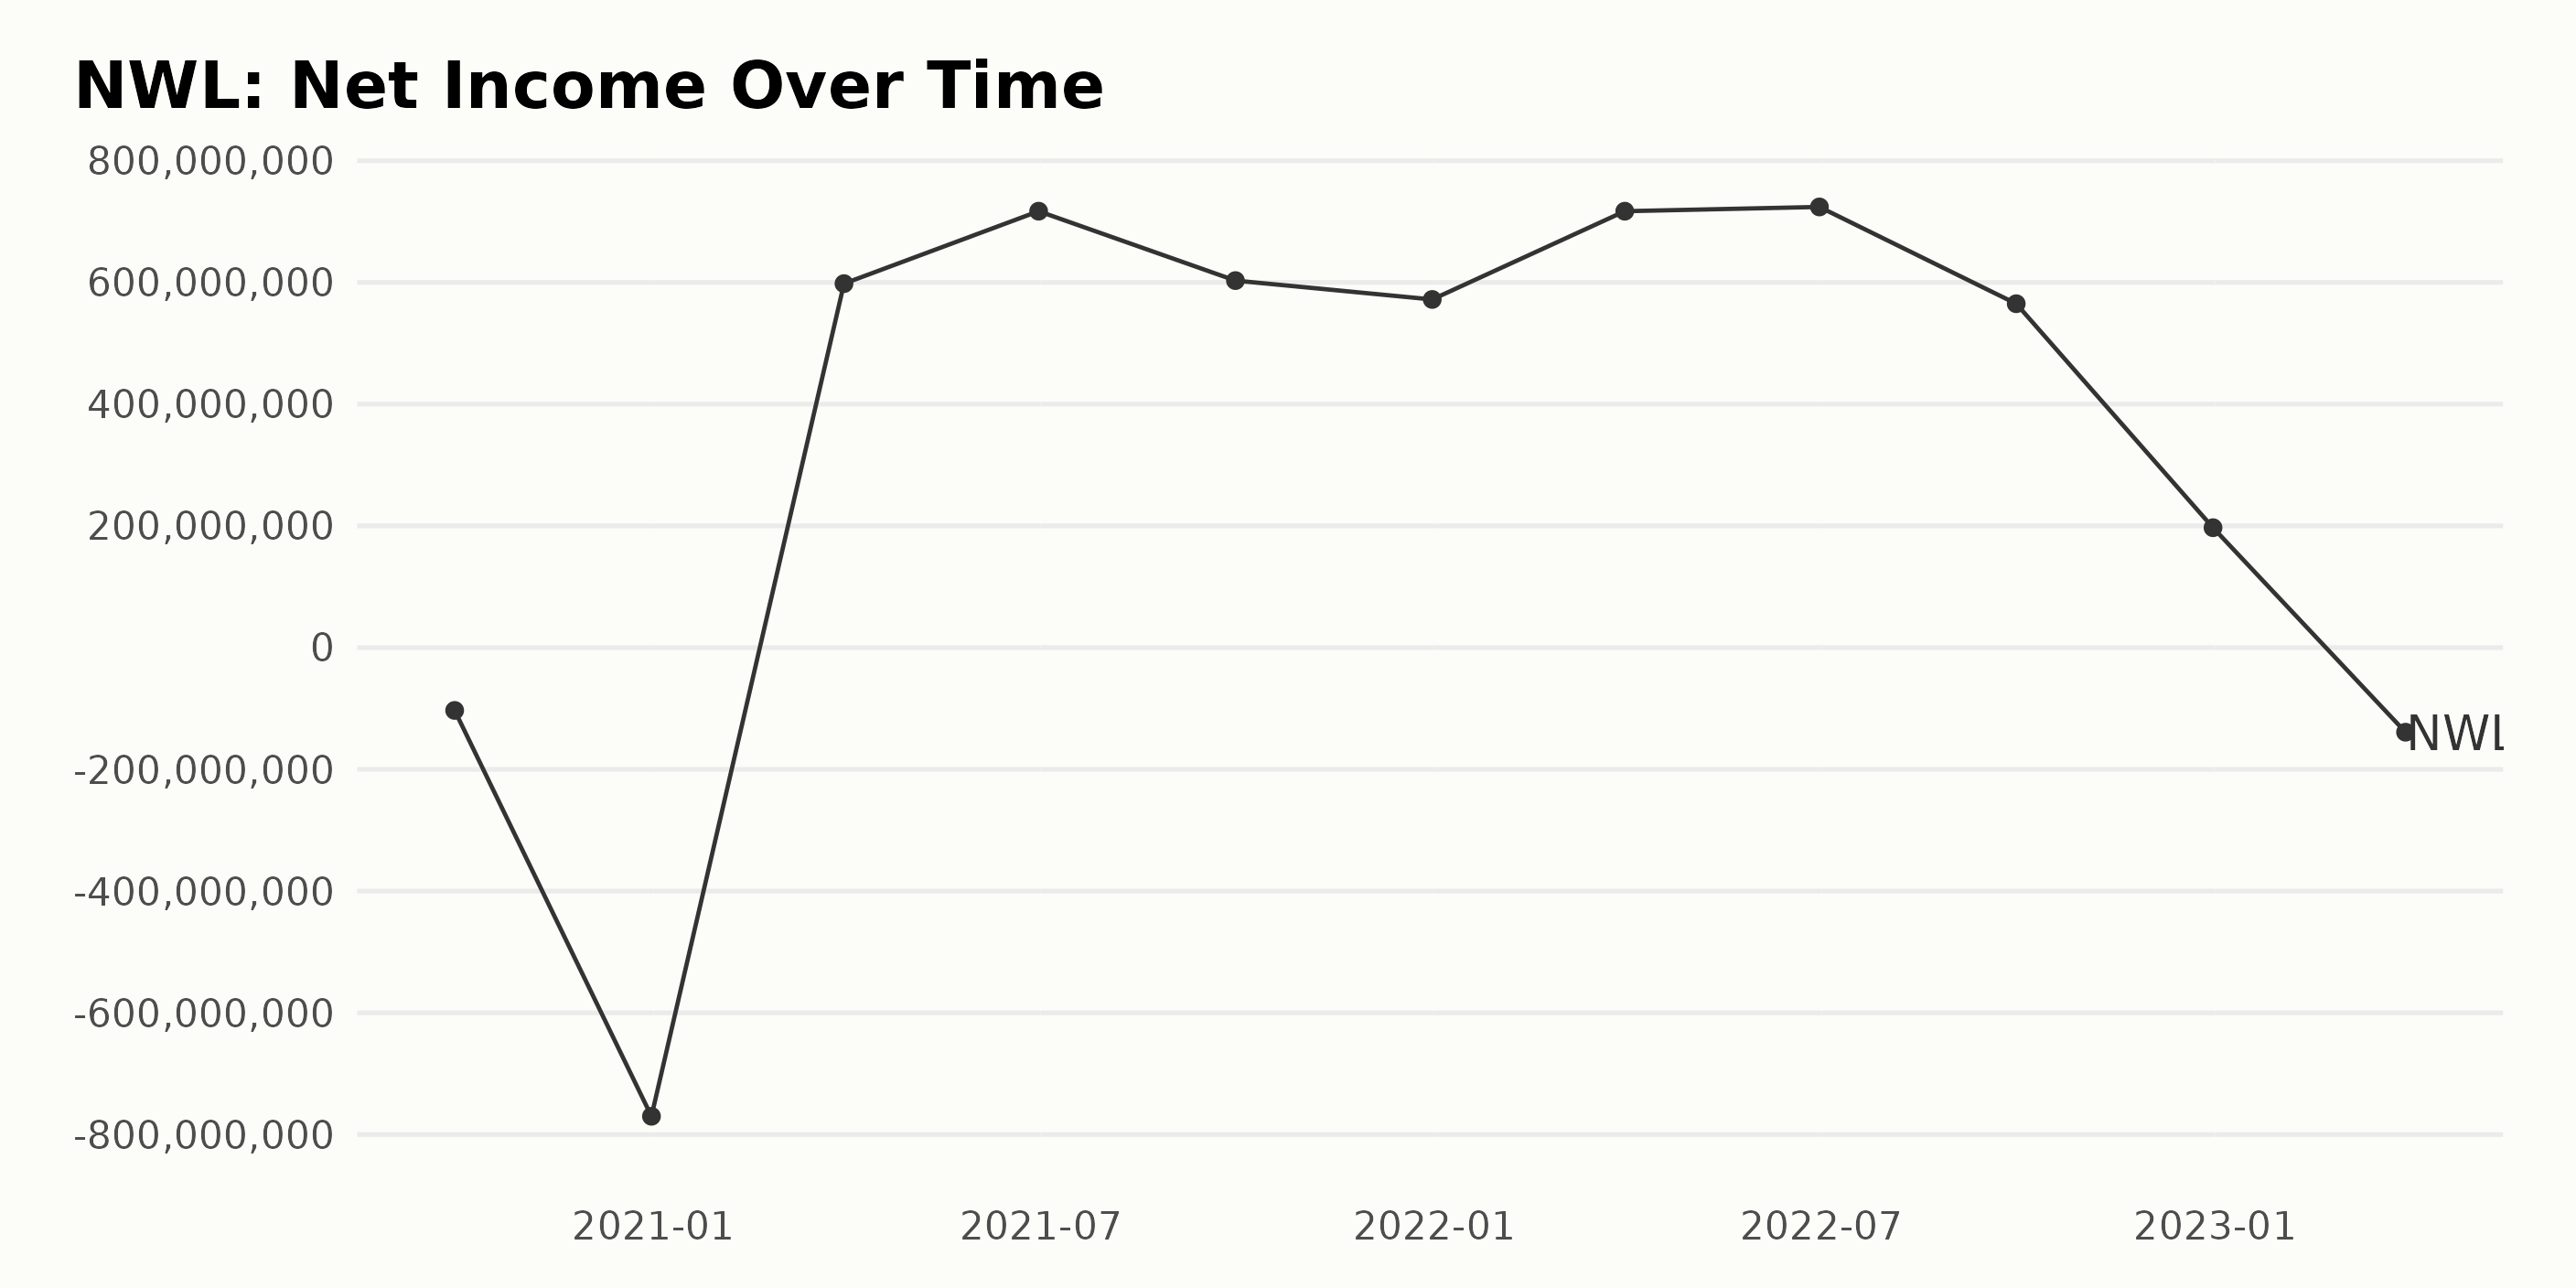
The trailing-12-month net income of NWL has shown both upward and downward movement from September 2020 to March 2023. Here is a brief summary of the fluctuations:
- At the start, NWL’s net income stood at a deficit of -$103.2 million in September 2020, which further dropped to -$770 million by December 2020.
- We then see a significant recovery in the first quarter of 2021 as NWL’s net income rose from a negative to a steady positive trend. The company reported $598 million in March 2021 and $717 million in June 2021.
- Despite small fluctuations, there was consistent growth in NWL’s net income until June 2022, where it peaked at $724 million.
- From September 2022 forward, we observe a sharp decline. The net income decreased from $565 million in September 2022 to $197 million in December 2022.
- The most recent data point from March 2023 reveals that the company returned to a negative net income of -$139 million.
Regarding the growth rate over this period, it appears inconsistent when measuring the first value from the last value, moving from -$103.2 million in September 2020 to -$139 million in March 2023. The more recent downward trend and the last reported value suggest that NWL is currently facing financial challenges.
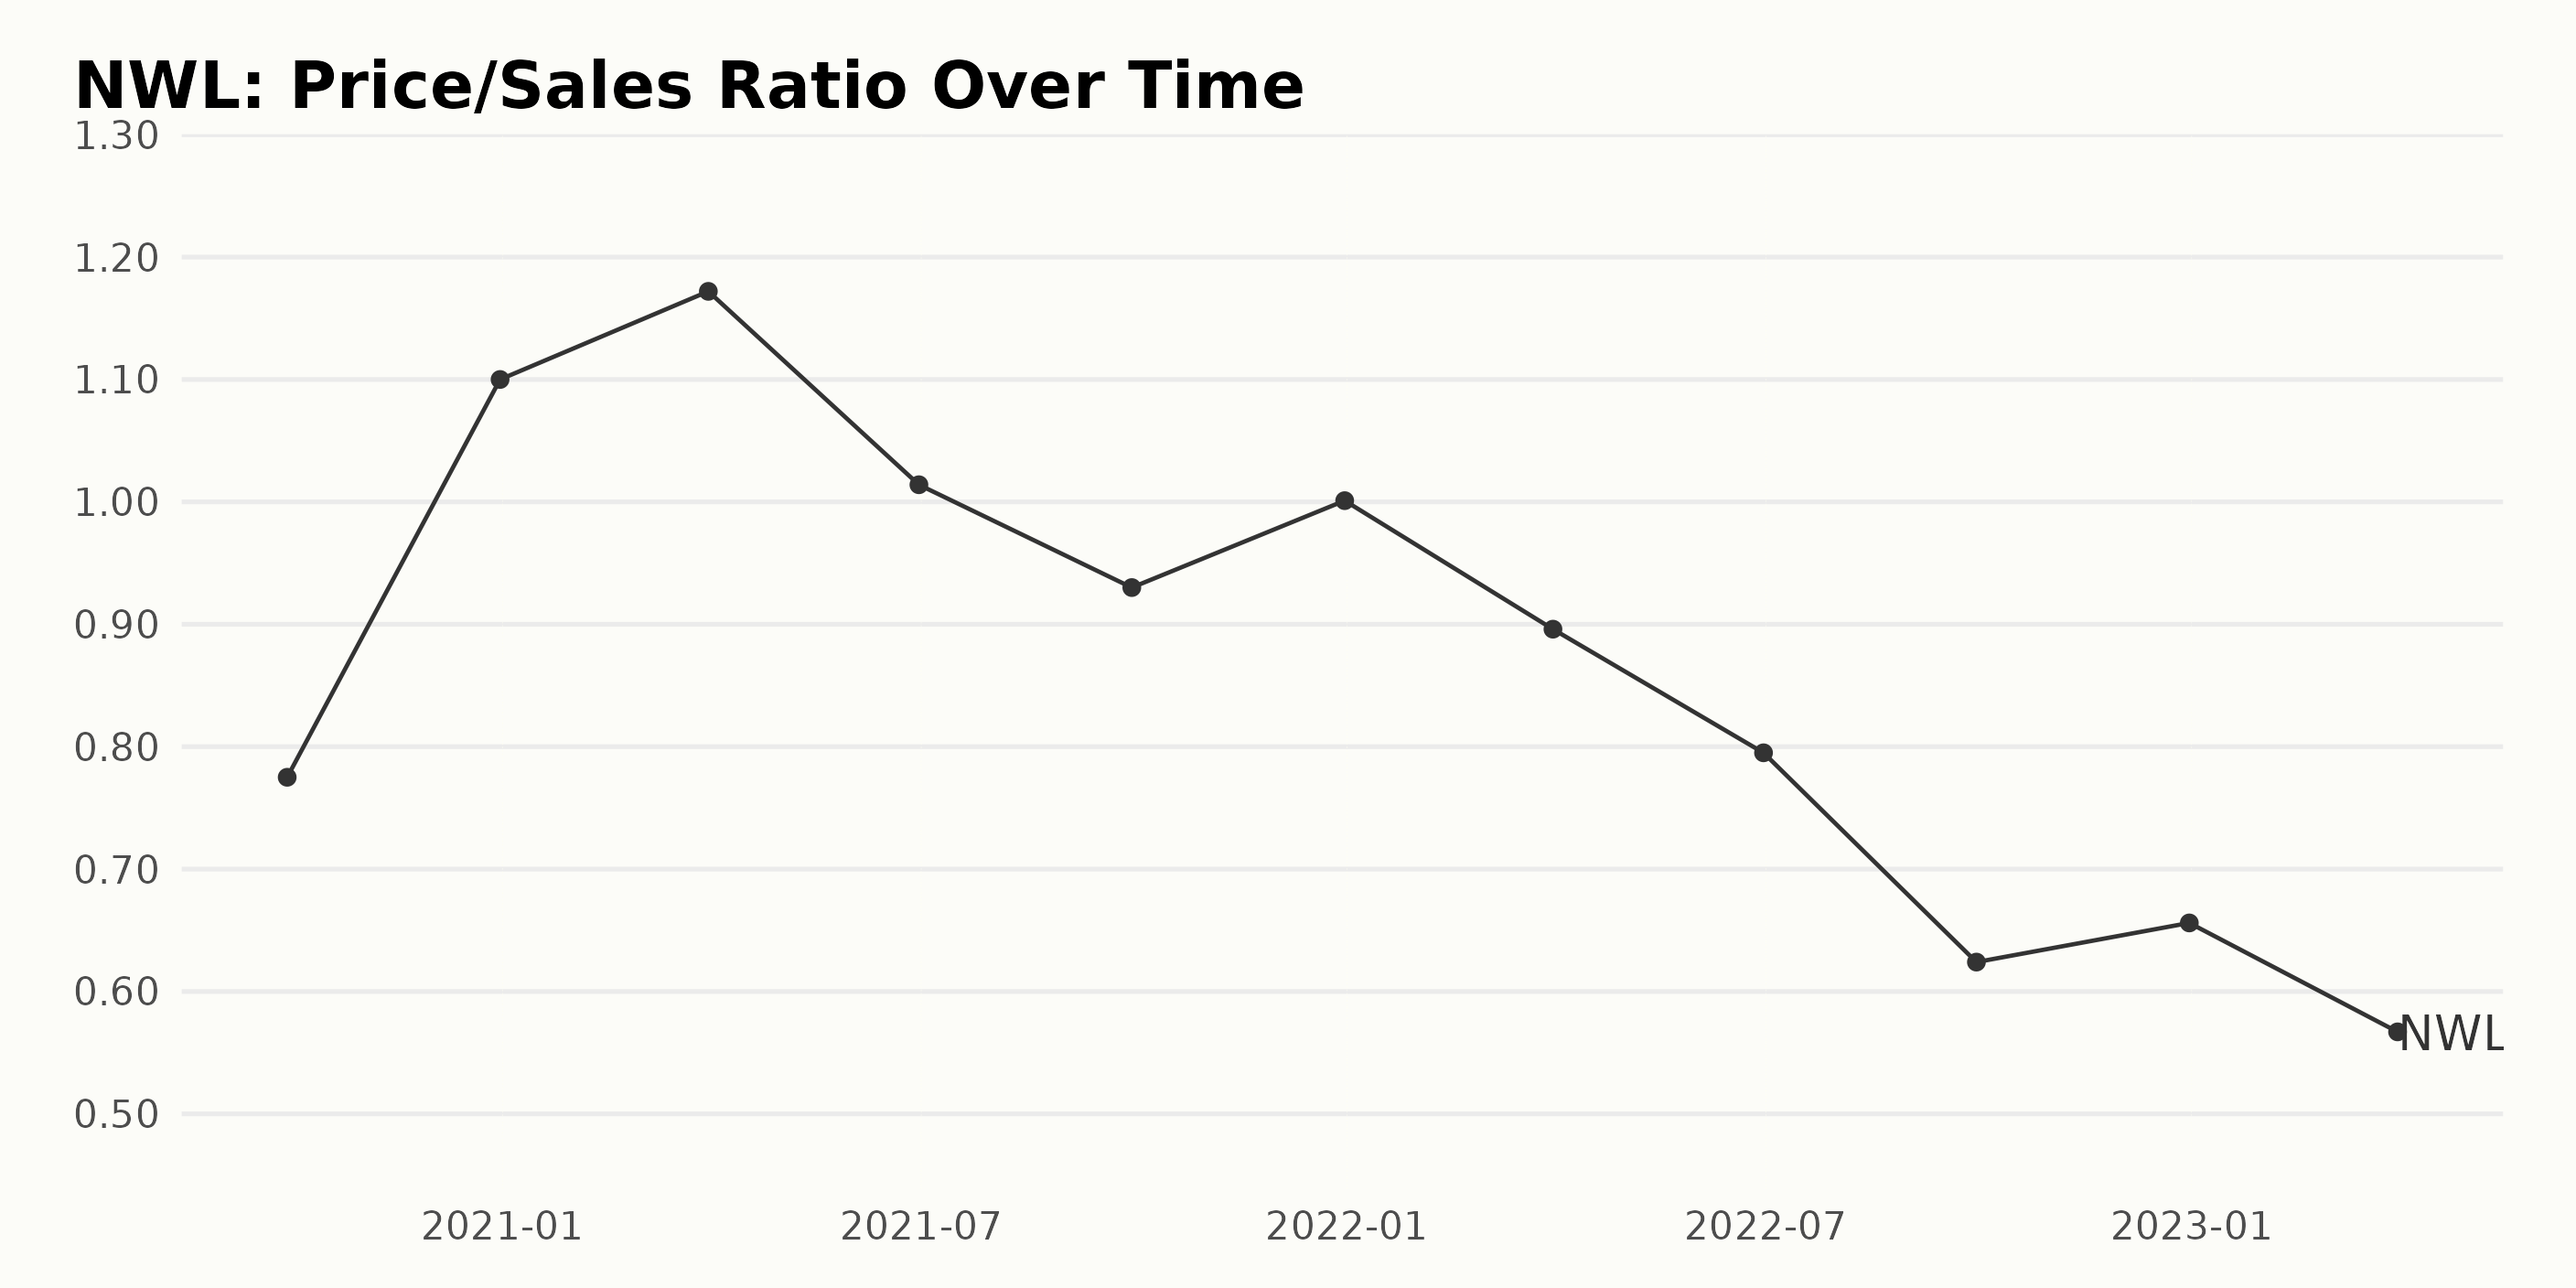
The reported Price/Sales Ratio of NWL demonstrates a fluctuating trend over the last few years, with significant emphasis on the more recent data.
- In September 2020, the P/S stood at 0.78, making it the baseline for further evaluation.
- By the end of 2020 (December), there was a sharp increase to 1.10, representing growth.
- The first quarter of 2021 saw the P/S climbing slightly higher to reach 1.17 before experiencing a decline in the second quarter to 1.01.
- The latter half of 2021 showed a decrease, with the third quarter reporting a P/S of 0.93 and a slight increase at the end of the year (December 2021) to 1.00.
- The trend continued downwards into 2022, and after reaching 0.80 in June, it further slid down to 0.62 by the end of the third quarter.
- A mild degree of recovery is noted in the last value of the data series for December 2022, with the P/S recorded at 0.66.
- Moving into 2023, the first quarter further dipped to 0.57.
Observing these various fluctuations, the data reveals an overall downward trend from September 2020 to March 2023. The P/S of NWL experienced occasional rises but ultimately fell from the original value of 0.78 to 0.57, showing a decline of about 26.9%.
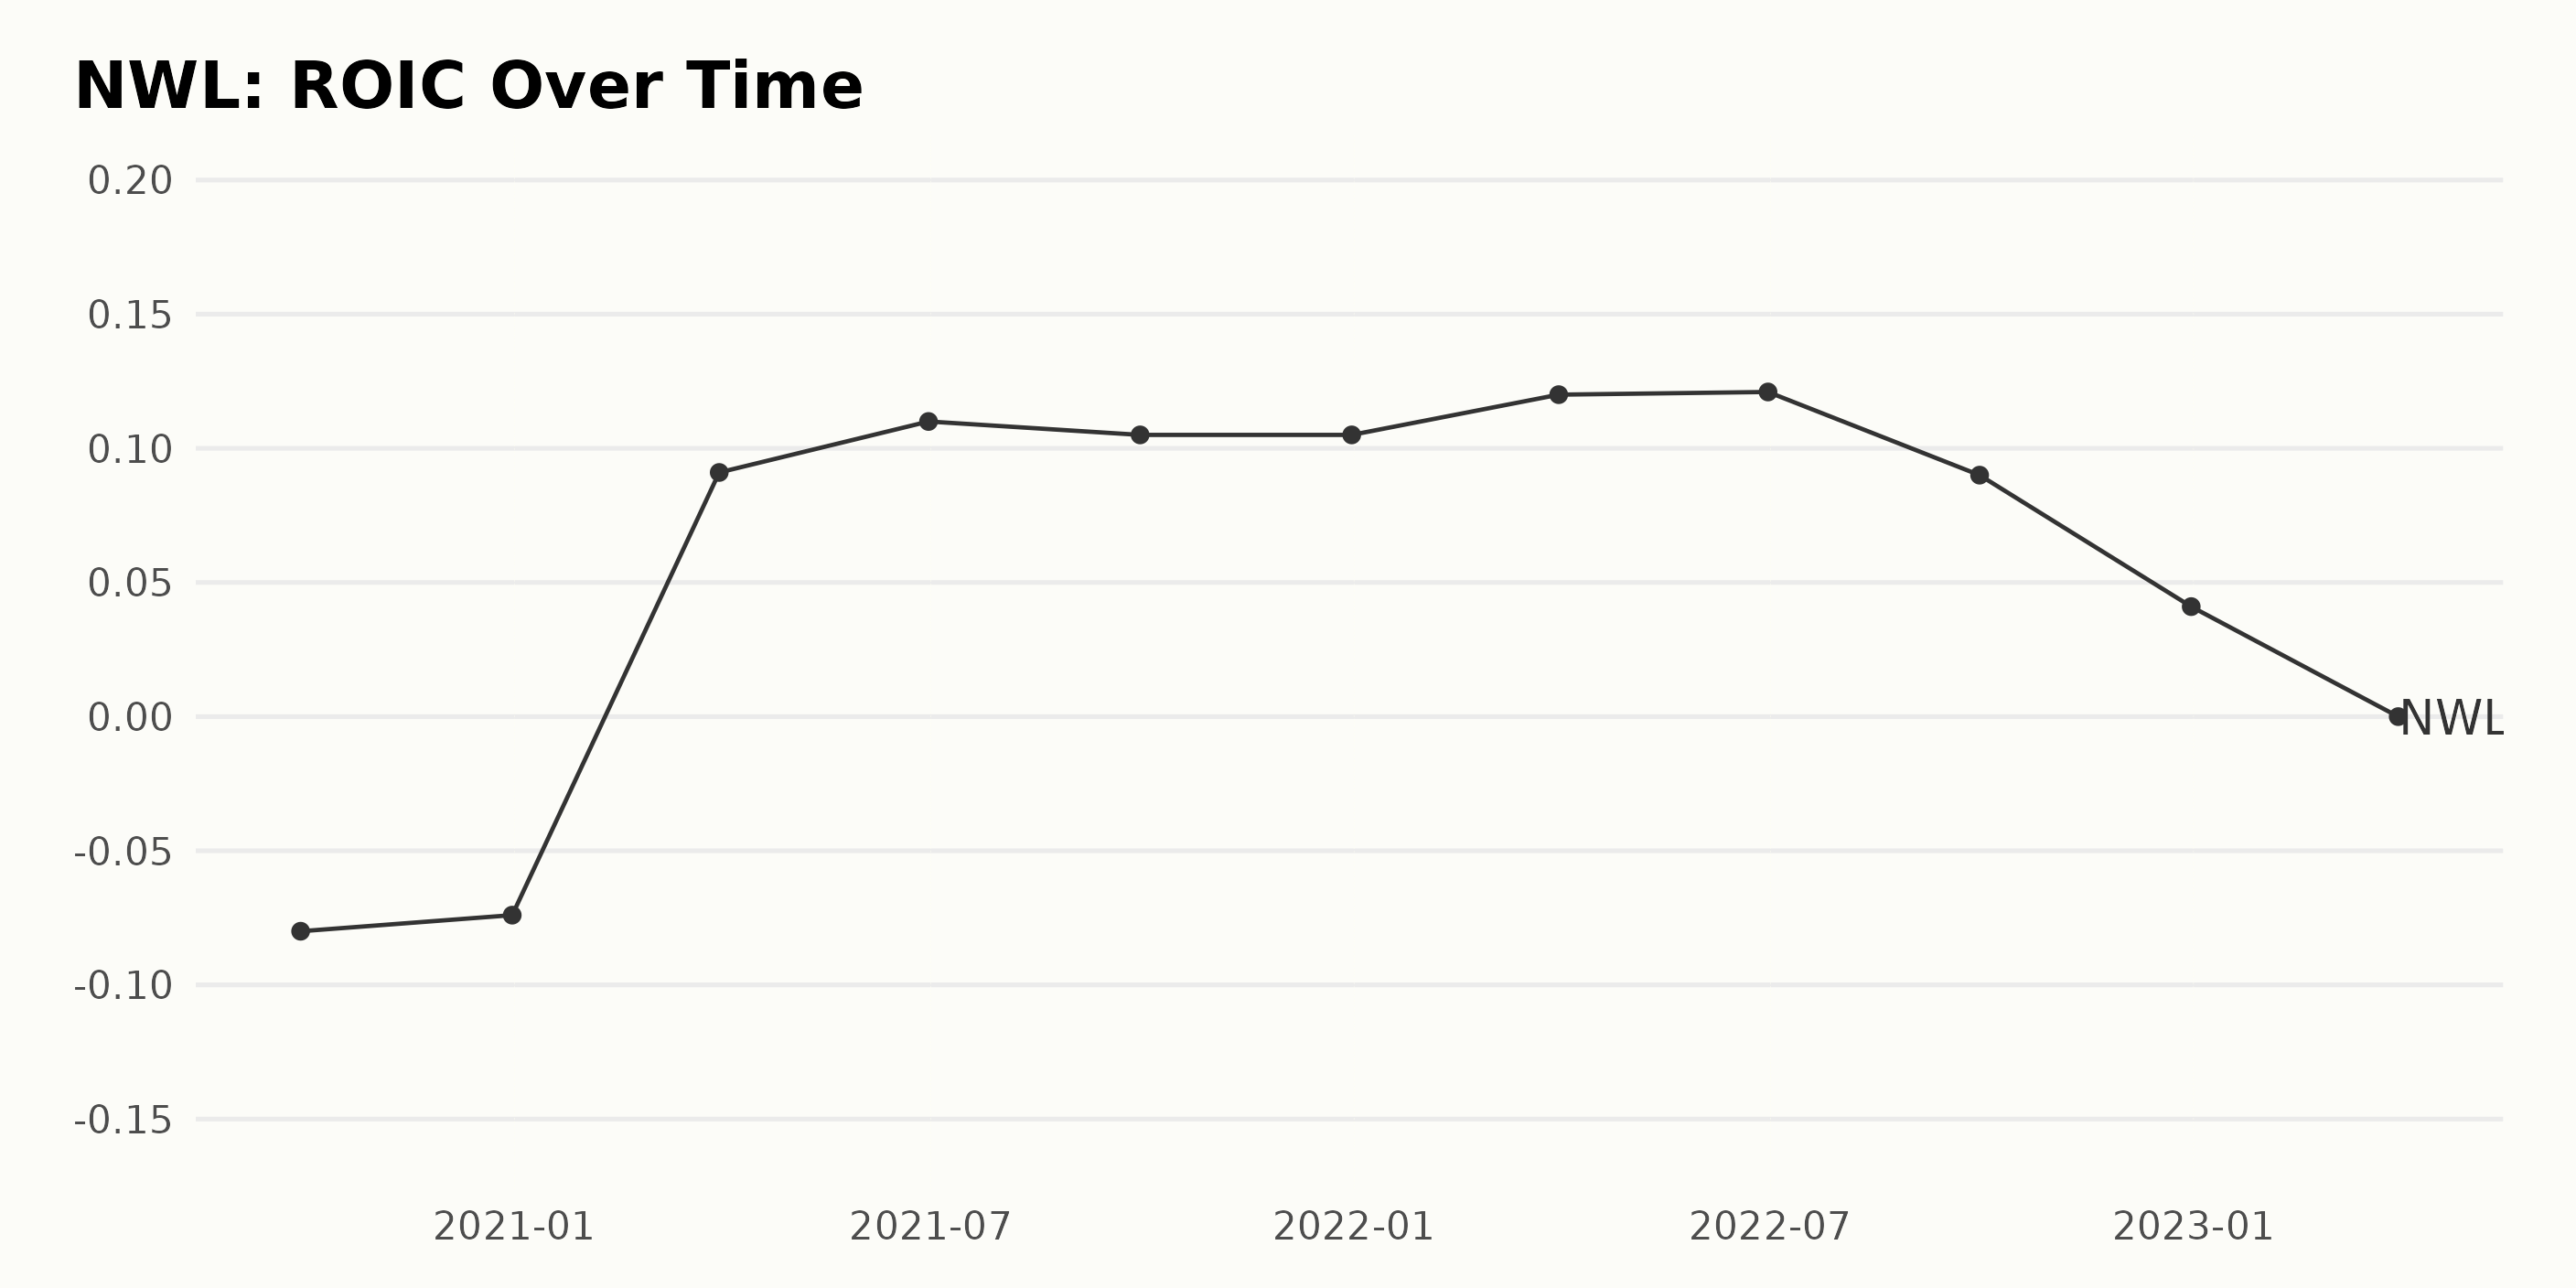
The trend and fluctuations of the ROIC for NWL can be summarized as follows:
- On September 30, 2020, the ROIC was -0.08.
- There was a slight improvement by December 31, 2020, with the ROIC increasing to -0.074.
- A significant increase was observed by March 31, 2021, as the ROIC rose to 0.091.
- From March 2021 to June 2021, the ROIC grew, reaching 0.11.
- The growth rate slightly declined between June 2021 and September 2021, with ROIC settling at 0.105. This value remained stagnant until the end of 2021.
- By March 31, 2022, the company experienced an uptick, with the ROIC reaching its highest point at 0.12. This further edged up to 0.121 by the end of June 2022.
- A sharp decrease was noted between June and September 2022 when the ROIC dropped to 0.09.
- This downward trend continued until the end of 2022, as the ROIC fell to 0.041.
- As of the most recent data available, as of March 31, 2023, the ROIC has decreased to 0.
In terms of growth rate from the first value to the last value in the series, there has been a notable change from -0.08 in September 2020 to 0 in March 2023. The company’s ROIC experienced significant fluctuations, with a noticeable upward movement until mid-2022, followed by a downward slump. The last few values in the series, especially the zero ROIC as of March 31, 2023, mark a concerning trend that warrants further exploration.
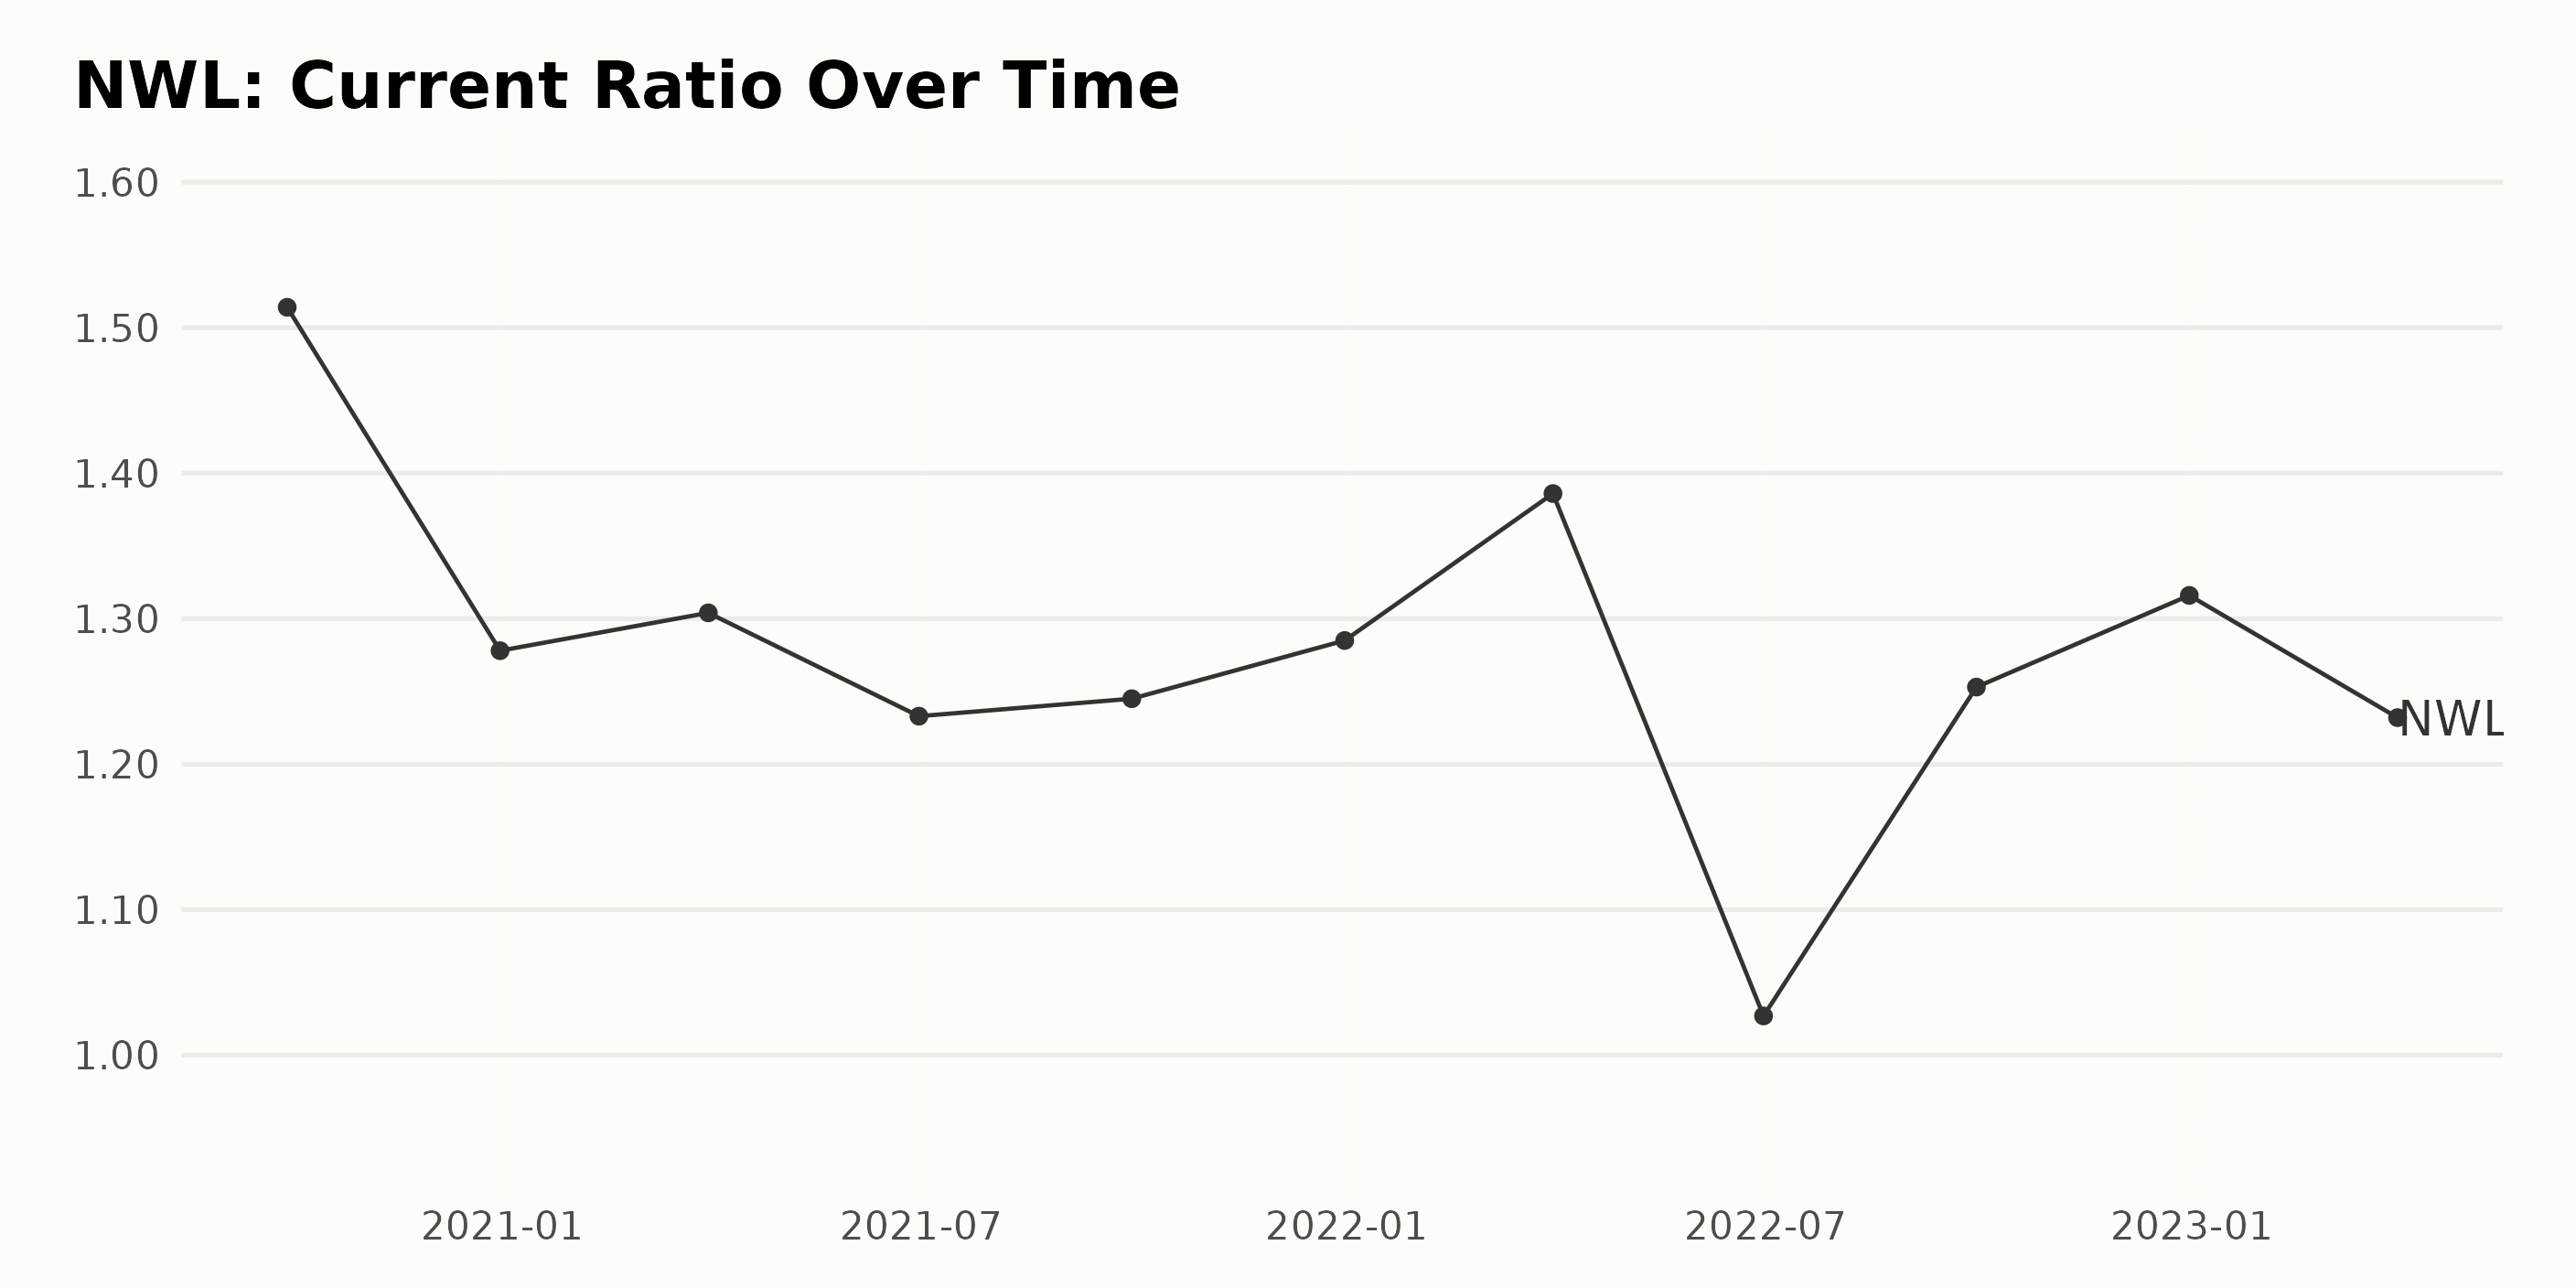
Here is the summary of the trend and fluctuations in the Current Ratio of NWL over time:
- At the beginning of the series on September 30, 2020, the Current Ratio stood at 1.51.
- A decline was observed towards the end of 2020 and into the beginning of 2021, with the Current Ratio dipping to 1.28 as of December 31, 2020, before mildly recovering to 1.30 by March 31, 2021.
- The Current Ratio continued to slide through June 2021, reaching a low of 1.23. However, it experienced a slight recovery by the end of September 2021, increasing to 1.24.
- By December 31, 2021, the ratio had climbed upwards to 1.29.
- The first quarter of 2022 saw an increase in the Current Ratio to 1.39, but a significant decrease was observed by the end of the second quarter, with the ratio dropping to 1.03.
- From the second half of 2022 onwards, the Current Ratio started recovering again, reaching 1.25 by September 30, 2022.
- As the year progressed, the Current Ratio climbed further to 1.32 as of December 31, 2022, before slightly dipping to 1.23 on March 31, 2023.
Over the course of the series, the Current Ratio experienced some variability, revealing a fluctuating trend. Between the start date (September 30, 2020 - CR: 1.51) and the end date (March 31, 2023- CR: 1.23), there is a decline of approximately 18.5% over the time period.
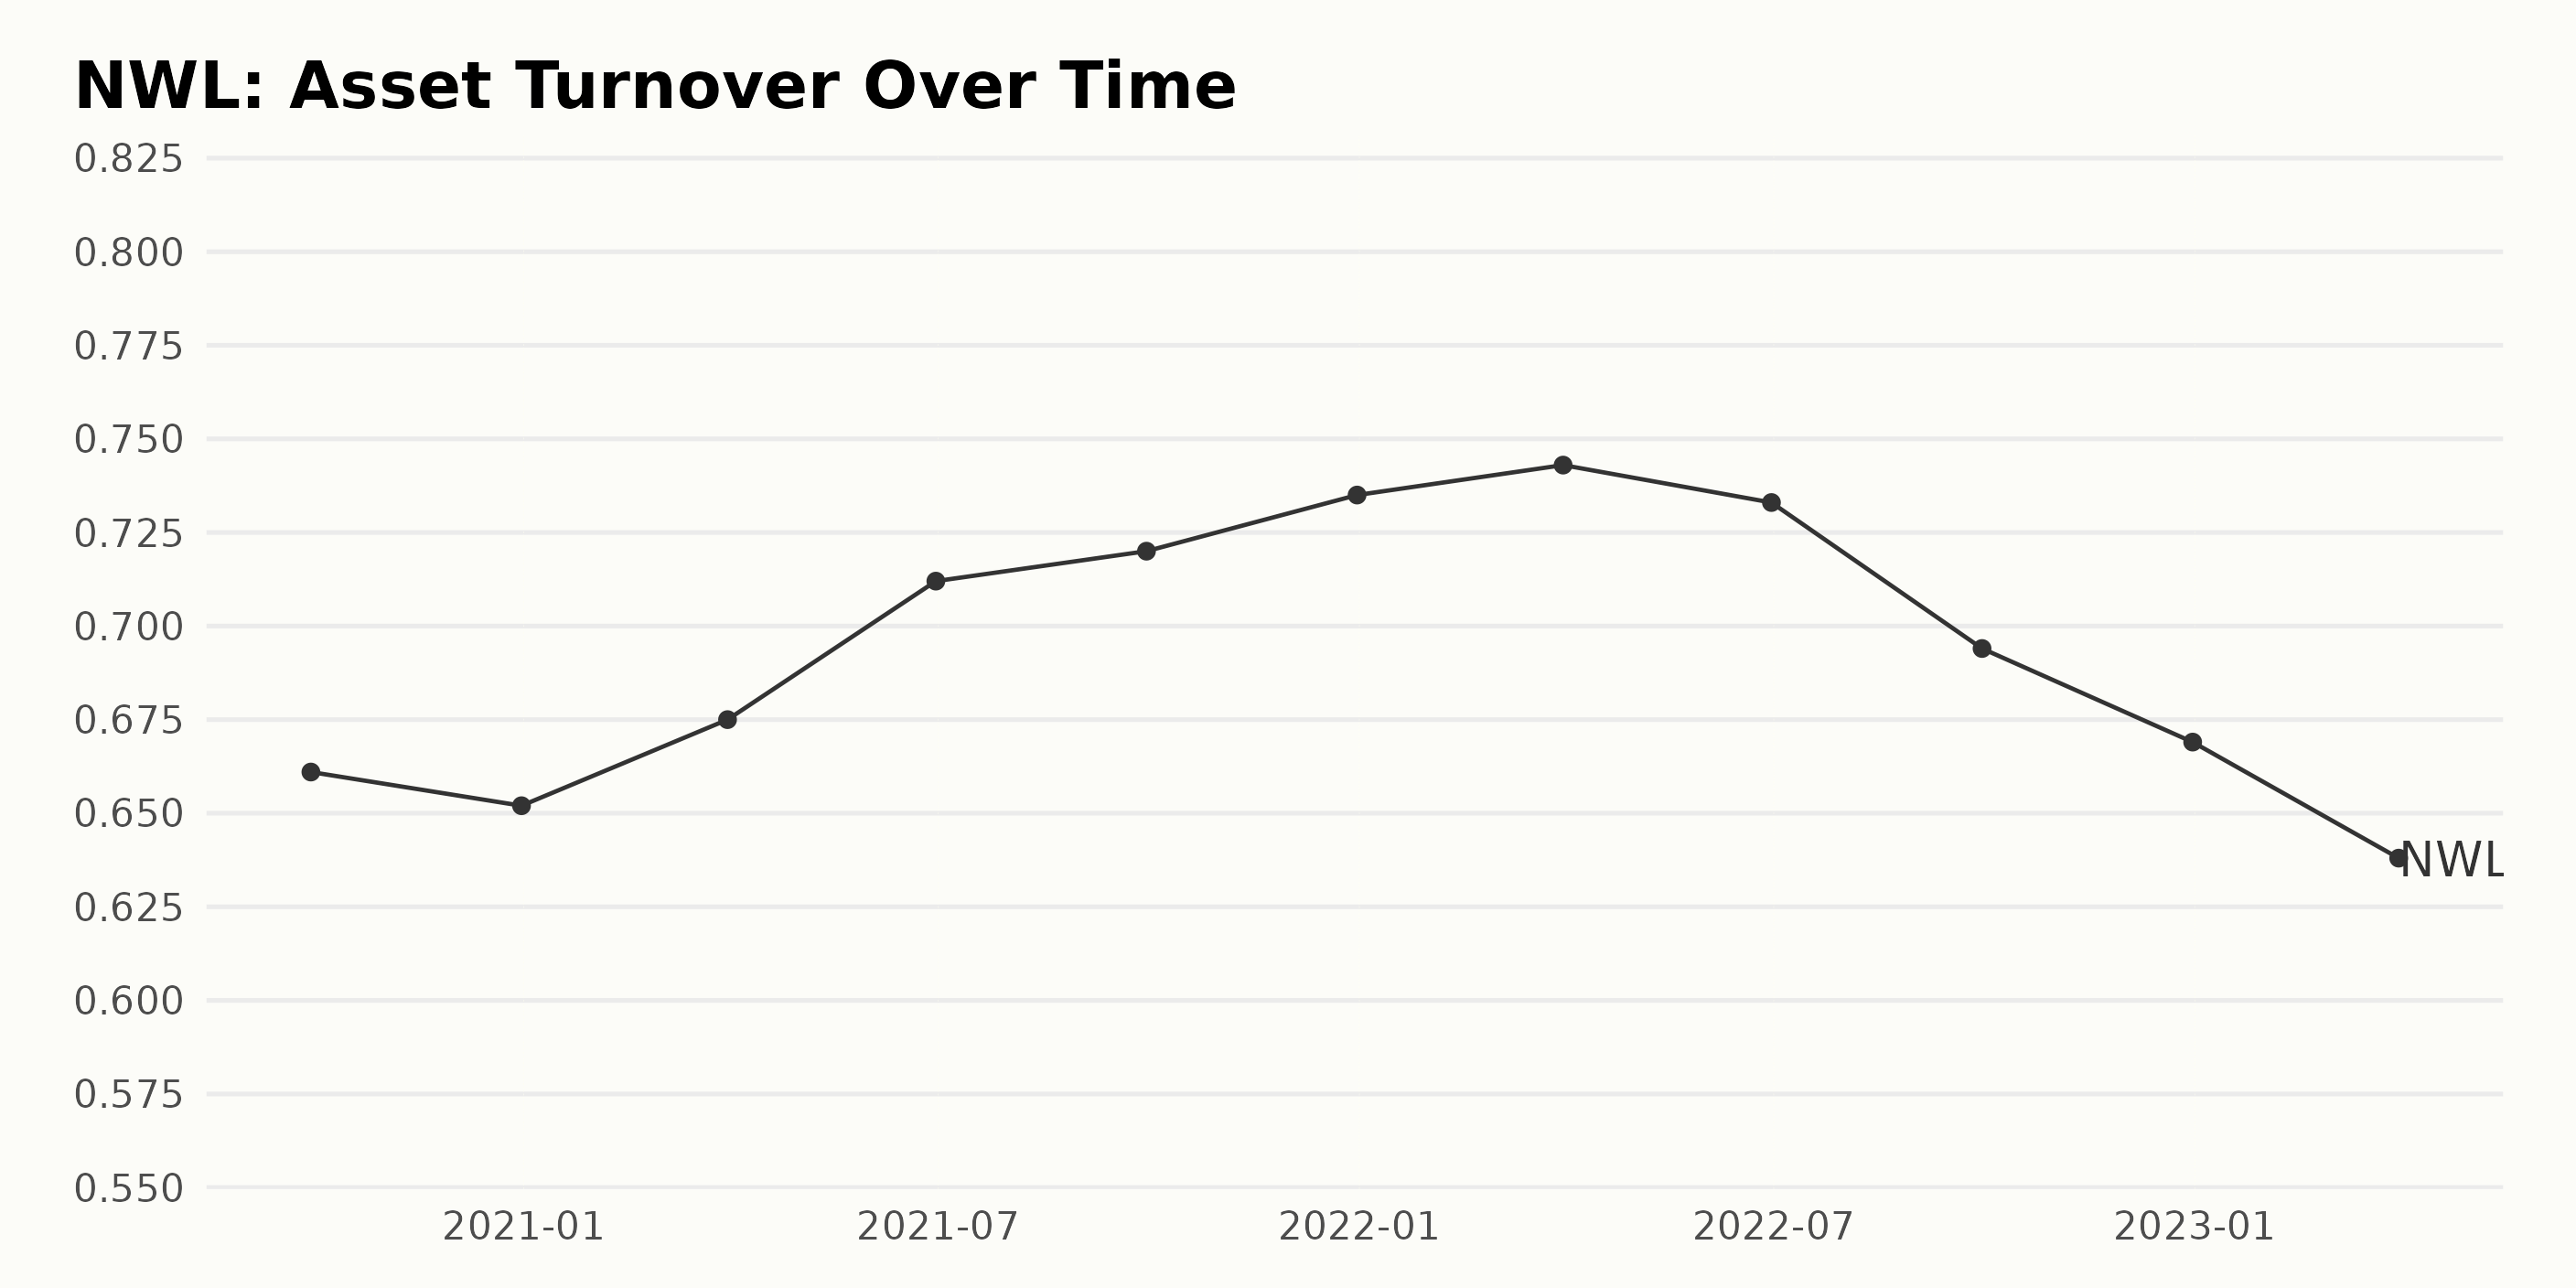
NWL asset turnover ratio has seen a fluctuating trend over the observed period from September 2020 through March 2023. -
- Starting at 0.66 in September 2020, the asset turnover ratio slightly decreased to 0.65 by December 2020.
- Entering 2021, growth was observed, with the value rising to 0.675 in March and then further increasing to 0.712 by June. The upward trend was sustained until the end of 2021, reaching its peak for the period at 0.735 in December.
- However, the asset turnover ratio began to decrease from the start of 2022. It dropped to 0.734 by March, further reduced to 0.73 by June, fell to 0.694 by September, and ended the year at 0.669 in December.
- This downward trend continued into 2023, where the lowest point of the series was recorded at 0.638 in March. The upward and downward fluctuations suggest considerable volatility in NWL’s asset turnover ratio.
After peaking at the end of 2021, there has been a clear negative trend, with the asset turnover ratio continuing to fall. The computed growth rate, taking the first value of 0.66 as a baseline, shows a decrease of approximately 3.3% by the last value in the series (March 2023).
2023 Half-Year Review: Newell Brands Inc. Share Price Demonstrates Declining Trend
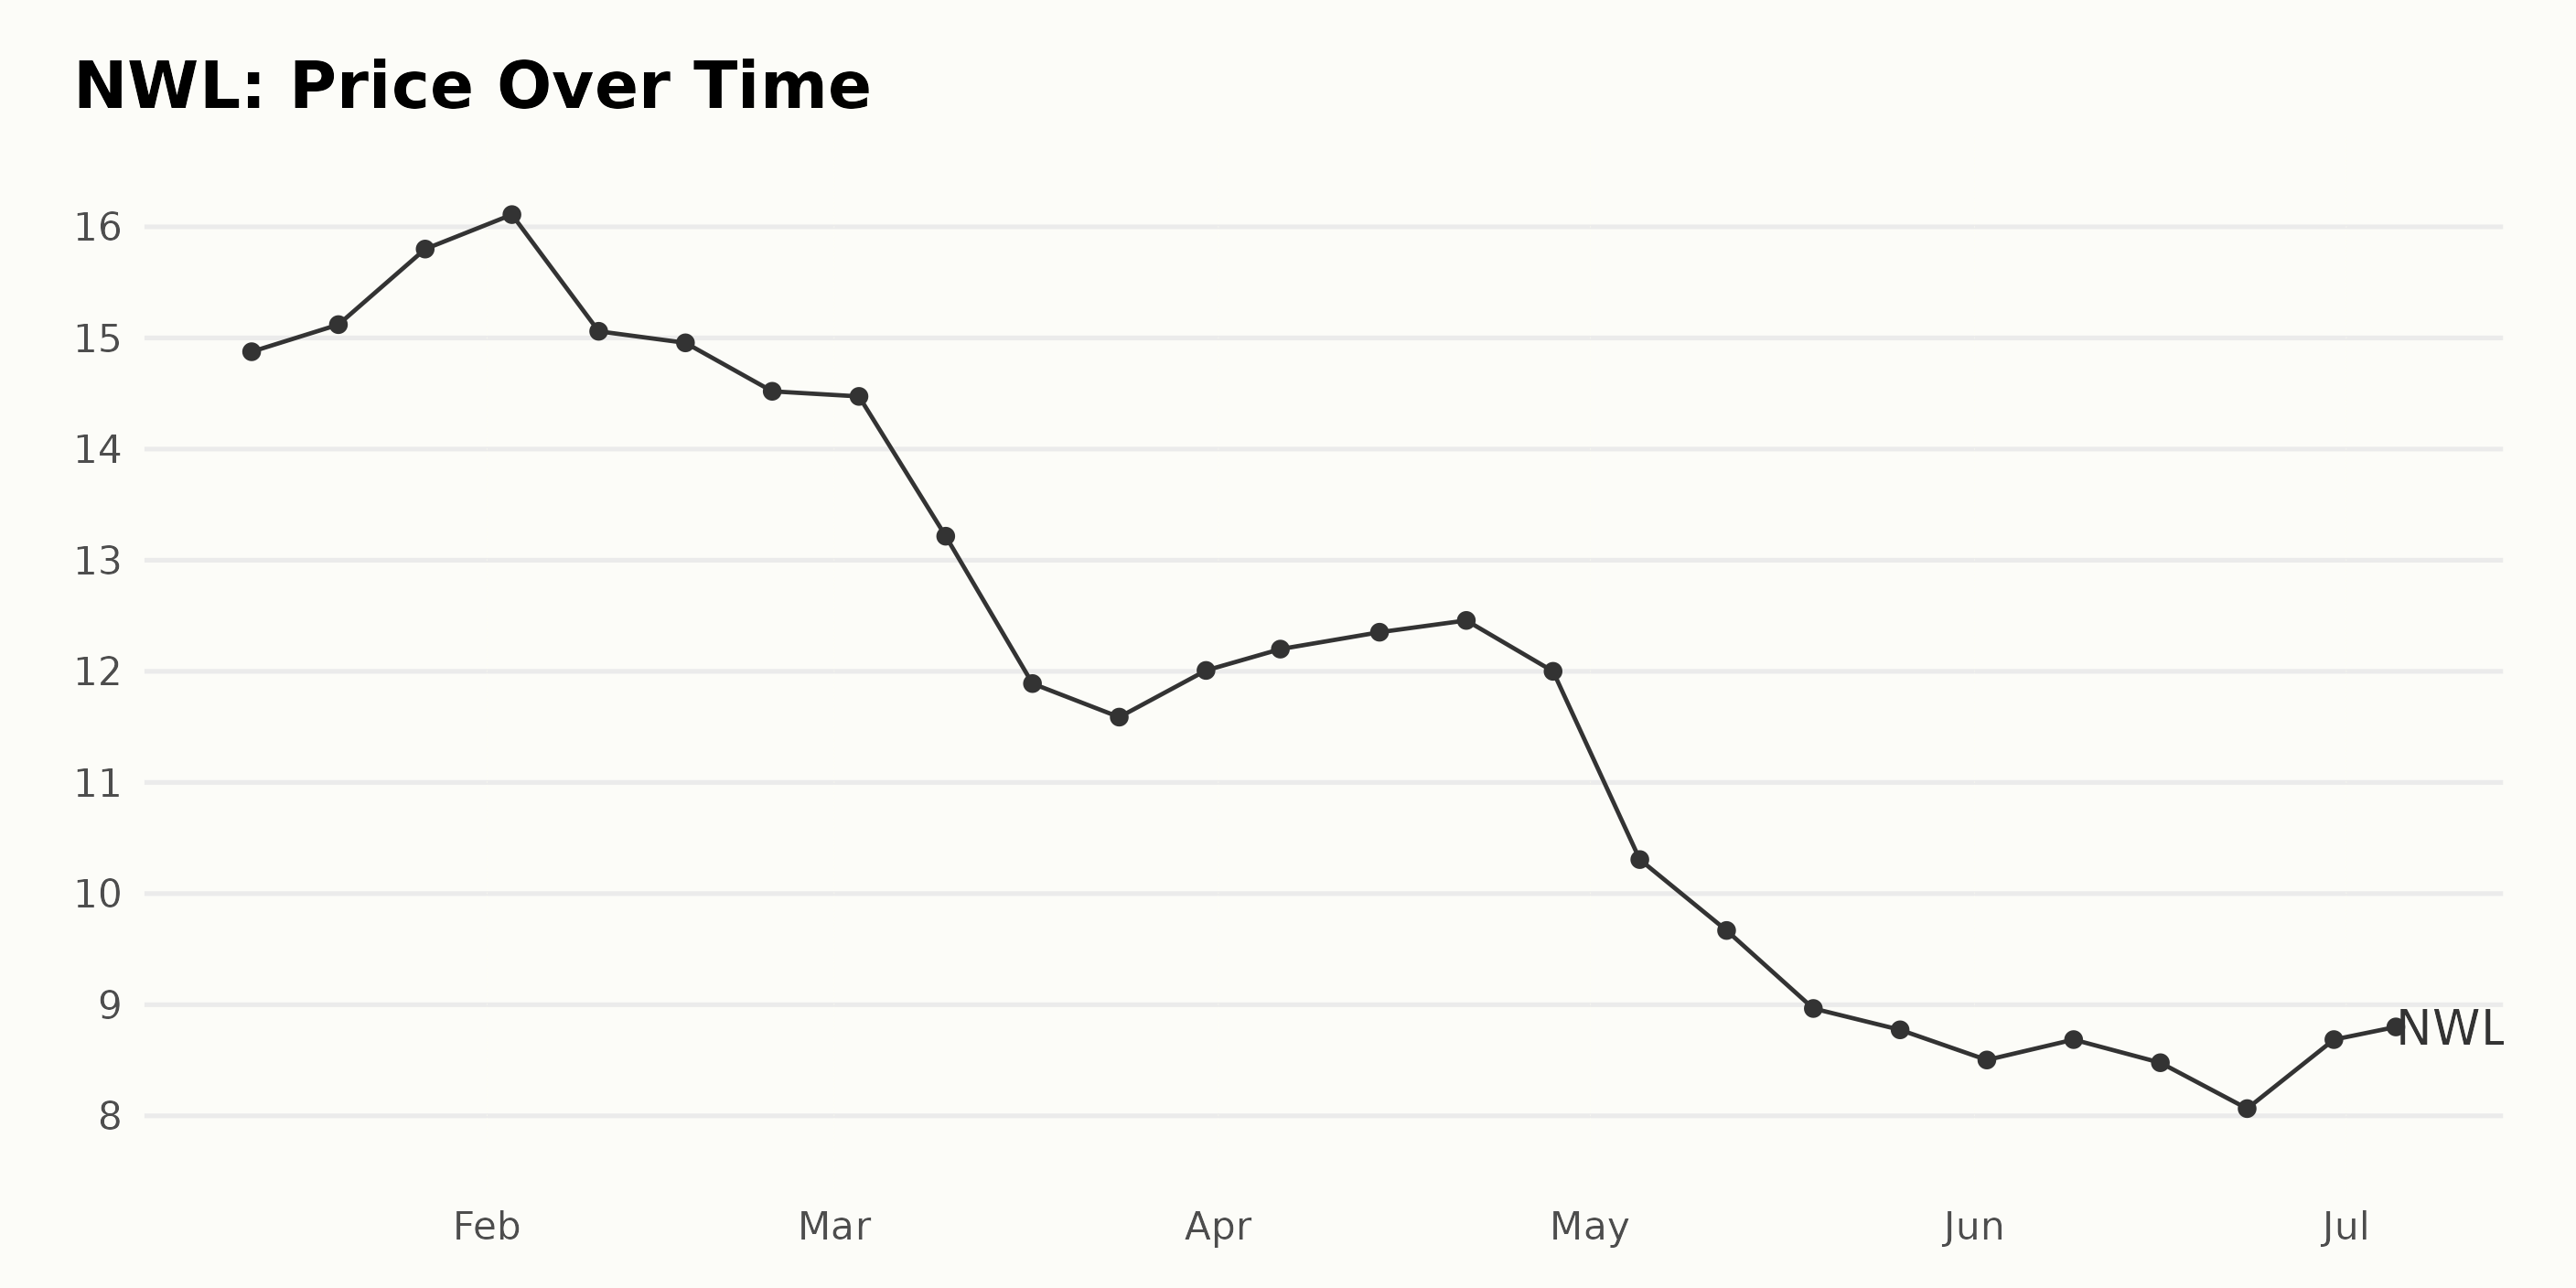
Based on the provided data, the share price of NWL demonstrates a declining trend during the examined period from January 13, 2023, to July 5, 2023. Here is a more detailed month-to-month breakdown:
- January 2023: The share price experienced mild growth, rising from $14.88 on January 13 to $15.80 by month’s end.
- February 2023: The share price peaked at $16.11 at the beginning of the month but then dropped to $14.52 by February 24 - an overall decline.
- March 2023: The price fluctuated slightly at the beginning, but then a sharp downward trend was observed, dipping from $14.47 to $11.59 within this month. This trend later rebounded slightly to finish the month at $12.01.
- April 2023: The share price continued to hover around $12 and demonstrated slight fluctuations, ending the month at $12.00 exactly.
- May 2023: A significant drop was seen in May, with the price decreasing consistently from $10.31 at the beginning of the month to $8.77 by the end.
- June 2023: Share prices continued the mild decline throughout June, with minimal increase experienced mid-month.
- July 2023: By July 5, the price had made a small recovery to reach $8.70, albeit still showing a prevalent downward trend compared to January’s figures.
In summary, shares of NWL have declined over this six-month period in 2023, with occasional periods of stabilization and mild recovery. Here is a chart of NWL’s price over the past 180 days.
Analyzing NWL’s POWR Ratings
NWL has an overall F rating, translating to a Strong Sell in our POWR Ratings system. NWL is ranked last in the Home Improvement & Goods category of stocks, which comprises 57 stocks in total.
This rating was attained during the week of July 5, 2023, and marks a recent decline in its performance within the category.
Here’s a summary:
- January 7, 2023: overall rating- C, Rank - 45
- February 11, 2023: overall rating- C, Rank - 43
- March 11, 2023: overall rating - D, Rank - 51
- May 6, 2023: overall rating - F, Rank - 56
- July 5, 2023: overall rating – F, Rank - 57
This indicates that NWL’s performance within the Home Improvement & Goods category has been subpar compared to other stocks in the same category, particularly in the latter half of the surveyed period.
Stocks to Consider Instead of Newell Brands Inc. (NWL)
Other stocks in the Home Improvement & Goods sector that may be worth considering are The Tile Shop Holdings, Inc. (TTSH), National Presto Industries, Inc. (NPK), and Flexsteel Industries, Inc. (FLXS). These stocks are rated A (Strong Buy).
What To Do Next?
Get your hands on this special report with 3 low priced companies with tremendous upside potential even in today’s volatile markets:
3 Stocks to DOUBLE This Year >
NWL shares were trading at $8.64 per share on Thursday morning, down $0.06 (-0.69%). Year-to-date, NWL has declined -32.34%, versus a 15.22% rise in the benchmark S&P 500 index during the same period.
About the Author: Kritika Sarmah

Her interest in risky instruments and passion for writing made Kritika an analyst and financial journalist. She earned her bachelor's degree in commerce and is currently pursuing the CFA program. With her fundamental approach, she aims to help investors identify untapped investment opportunities.
The post Newell Brands (NWL): Buy, Sell or Hold for July? appeared first on StockNews.com