I’m going to let you in on a little secret. While the financial publication industry has been dominated by the methodologies of fundamental and technical analysis, the harsh reality is that these approaches don’t actually qualify as “analysis.” Instead, they’re opinions based on someone’s interpretation of fair value or breakout patterns.
However, describing a methodology as merely a guess would cause it to lose credibility. So, we just slap on the analysis label and suddenly, the underlying process becomes a certified discipline. Only in America, folks.
While there’s wrong per se about opinions — after all, any forecast about the unknown future is exactly that — the issue centers on contingency. With fundamental and technical analysis, both the premise and the conclusion stem entirely from the author; change the author, change the analysis. That means a forecast’s insights and overall viability are dependent on the analyst as the individual, not the analysis as a research protocol.
Fortunately, there’s a better way around this mess and that’s quantitative analysis. Foundationally, the quant approach builds upon the observations of GARCH (Generalized Autoregressive Conditional Heteroskedasticity) studies, which describe the diffusional properties of volatility as clustered, non-linear phenomena.
By logical deduction, then, the quant model runs on this probabilistic engine: different market stimuli yield different market behaviors.
It’s really common sense. For example, a 250-pound linebacker can dish out more force than a 160-pound cornerback. What we do in the market, then, is to identify these linebackers and calculate the force that they would be expected to generate.
Essentially, by finding the force, we find the propensity of where a security may end up. With that introduction out of the way, let’s take a look at some compelling ideas.
Keurig Dr Pepper (KDP)
Recently, Barchart content partner MarketBeat published an article that asserted that Keurig Dr Pepper (KDP) was in the “buy zone” and that it’s now time to build a position in KDP stock. I happen to agree with the assertion but I must admit confusion at the methodology. Specifically, the analyst points to institutional trends being robust as an upside catalyst.
Further, the author pointed to technical trends, stating that the “market for KDP stock is unlikely to fall below critical support targets in this scenario.” But how does the expert gauge the probability of not falling below support? This statement is just taken for granted and that’s where the utility of technical analysis falls short. Luckily, quantitative analysis goes deeper.
Under the quantitative model, we know through data collected from January 2019 onward that the projected 10-week outcomes of KDP stock form a distributional curve, which ranges mostly from $27.12 to around $$27.37 (assuming an anchor of $27.16, Friday’s close). Also, price clustering would be predominant at around $27.22.
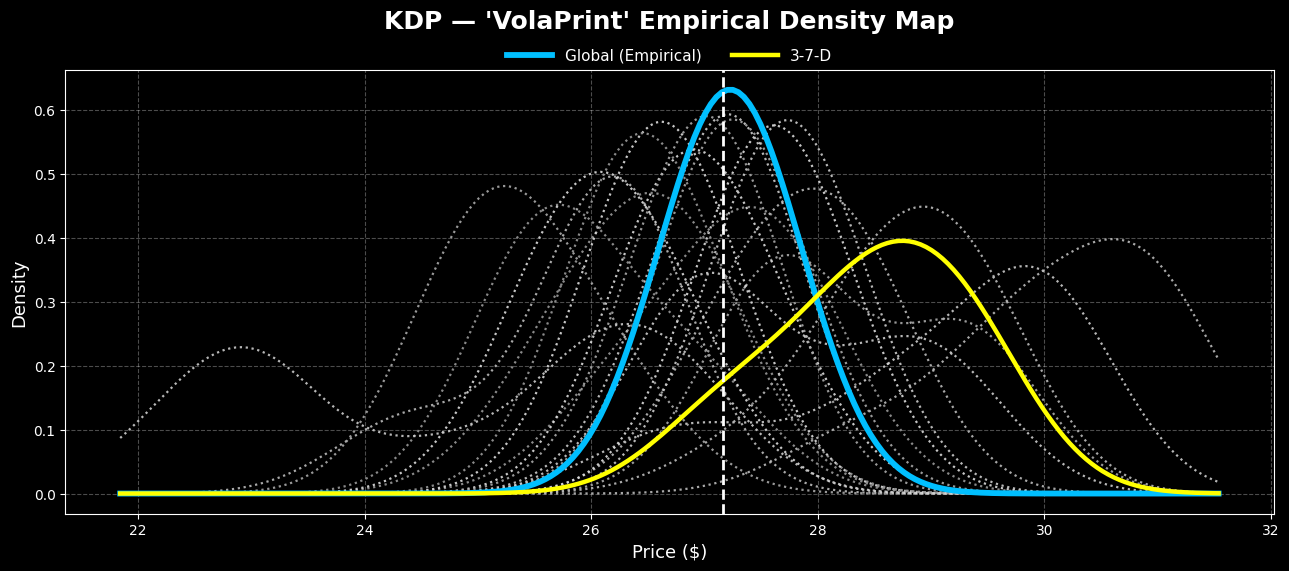
However, KDP stock is currently structured in a 3-7-D formation: three up weeks, seven down weeks, with an overall downward slope. Under this sequence, price clustering would be predominant at around $29. Therefore, by observing the debit-based transactions available through a Barchart Premier membership, the 28/29 bull call spread expiring Dec. 19 arguably makes the most sense.
Texas Instruments (TXN)
Do you know how else we can decipher the epistemological shortcomings of fundamental analysis? Analysts often have wildly diverging price targets, which shouldn’t make sense. We know that Wall Street is using the same methodology called fundamental analysis. Therefore, if the methodology resembled anything close to a science, analyst price targets would narrow. Instead, they sometimes get wider — even with the introduction of more data!
Take a look at Texas Instruments (TXN). What’s fascinating about this semiconductor giant is that the spread between the highest analyst price target and the average outlook is a whopping 30.2%. Further, the difference between the high and low targets is 100%. You see it with your own eyes. People are just guessing out there. The only reason they have credibility is that they appear on TV and wear a nice suit.
Under baseline conditions, TXN stock’s forward 10-week return profile ranges from $159 to $169 (assuming an anchor of $161.46). However, right now, TXN is structured in a 3-7-D formation. Under this sequence, the expected risk-reward spectrum expands to $157.50 on the low side to $175 on the high.
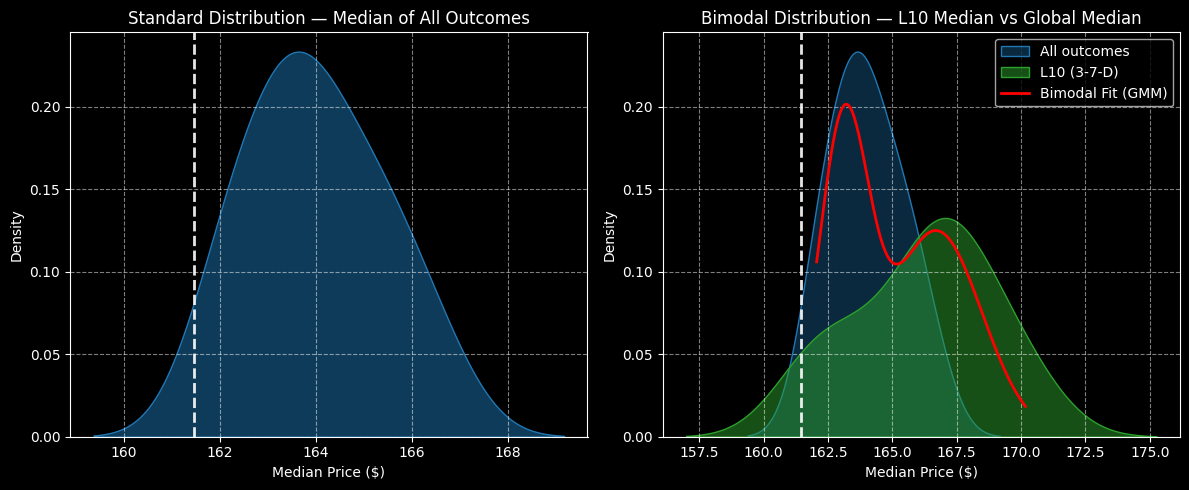
Significantly, price clustering would be predominant at around $167. This translates into a 6.03% positive delta in price density dynamics. Those who are aggressive may consider the 165/170 bull spread expiring Dec. 19, which features a breakeven price of $167.20.
Carvana (CVNA)
Saving the riskiest idea for last, Carvana (CVNA) has been struggling due to a mixed earnings report. While the company posted impressive revenue of $5.65 billion, which beat the consensus view of $5.08 billion, it fell short on guidance. Subsequently, CVNA stock slipped 14% in the business week ending Halloween. Also, in the trailing month, the security fell more than 22%.
Still, for those who are willing to take a potshot, CVNA stock could be an intriguing contrarian opportunity. Under baseline conditions, CVNA’s projected 10-week outcomes would be expected to range between $290 to $365 (assuming an anchor of $306.54). Further, price clustering would be predominant at approximately $319.
However, the security is presently structured in an ultra-rare 6-4-D sequence. Under this framework, the risk tail would be about the same under baseline (roughly $290). However, the reward tail would shoot past $400. Most significantly, price clustering would be expected at $363.
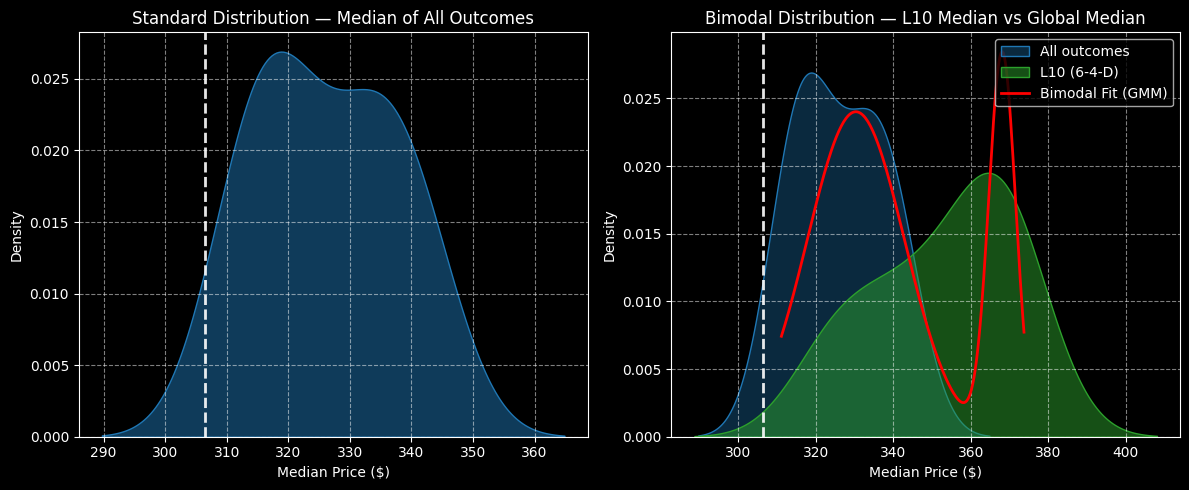
With these figures, the most tempting trade would be the 350/360 bull spread expiring Dec. 19, which features a maximum payout of over 233%. Those who want a more probabilistically tractable trade may consider the 330/350 bull spread, also expiring Dec. 19. However, the payout would drop to 145.4%.
On the date of publication, Josh Enomoto did not have (either directly or indirectly) positions in any of the securities mentioned in this article. All information and data in this article is solely for informational purposes. For more information please view the Barchart Disclosure Policy here.
More news from Barchart
- The Saturday Spread: Exploiting the Information Arbitrage That No One is Talking About
- The Only 3 Dividend Kings You’ll Ever Need for a Lifetime of Income
- This Pair of New 2X ETFs Goes Double or Nothing on Big Tech. Should You Chase the Volatility in Apple, Nvidia, and Microsoft Now?
- Analysts Say You Should Ignore ‘Short-Term Blips’ and Keep Buying Microsoft Stock