As a satellite designer and manufacturer, AST SpaceMobile (ASTS) plays a pivotal role in the burgeoning space economy. Subsequently, it’s one of the most relevant enterprises in the market and its performance shows. Since the start of the year, ASTS stock has gained almost 251%, a simply blistering rally. At the same time, it’s fair to wonder whether the upswing is sustainable or not.
Sure, for both patient investors and near-term speculators, the rewards have been bountiful. For example, in the past five sessions, ASTS stock jumped over 39%, making it one of the top names during the period. However, since mid-October, the security slipped about 23%, which is a sizable loss. What’s more problematic, the options market — which is typically the domain of the smart money — is broadcasting pensiveness.
How do we know? Obviously, no one is claiming an absolute metaphysical truth. That said, in AST’s unusual options screener, all of the top transactions (as defined by the volume-to-open-interest ratio) feature implied volatility (IV) above 100%. In other words, we’re not just talking about heightened IV for calls or puts but for both across various strike prices.
From a logical inference standpoint, such behavior indicates that the smart money is focused on hedging in either direction. As such, the contract premiums are expensive (based on the elevated IV). Basically, the folks that are benefiting the most — at least for the time being — are credit sellers.
However, what traders might not be appreciating is that ASTS stock just flashed a quantitative signal — and this may have directional or more specifically bullish implications.
ASTS Stock is Ultimately a Game of Probabilities
Looking at the chart for ASTS stock, you can easily see that, while the general trajectory is bullish, the trend isn’t perfectly linear. Instead, the price action over a given period of time — let’s say one year — features many undulating spikes and valleys. From the perspective of quantitative analysis, we want to use empirical data to craft a probabilistic trading strategy.
It all starts with objectification.
In a social context, objectification is typically an ugly concept as it involves taking the richness of a human being and compressing their value to just their physical appearance. However, if we wanted to conduct a sociological study — for example, the correlation between height (being tall) and positive outcomes in looking for a job — this value compression is a necessity. That’s because you need some way of neatly classifying otherwise unique individuals into discrete buckets for the purpose of extracting a deeper truth.
As it turns out, studies published on the National Library of Medicine’s website have demonstrated a positive correlation between height and labor market success. In the same vein, my hypothesis is that a correlation also exists between a major publicly traded security like ASTS stock and the prior sequence of bullish and bearish behaviors. And naturally, the best way to objectify price action is to compress everything into up weeks or down weeks.
Of course, the equities market is hampered by a formatting issue: all securities represent a singular journey across time. So, what we need to do is to break the discretized price action into rolling sequences or windows. With this formatting change, we can observe multiple trials of price behaviors. Over enough trials, certain patterns start to emerge.
Perhaps the most important pattern is probability density: in this case, the likelihood that ASTS stock will land at a particular price over a given period of time.
Leveraging Risk Geometry to Trade AST SpaceMobile
Following the objectification process and running a probabilistic algorithm on the ASTS stock price, its forward 10-week returns can be arranged as a distributional curve, with outcomes ranging between $72.80 and $74.50 (assuming an anchor price of $74, Monday’s close). Further, price clustering would likely be predominant at around $73.70.
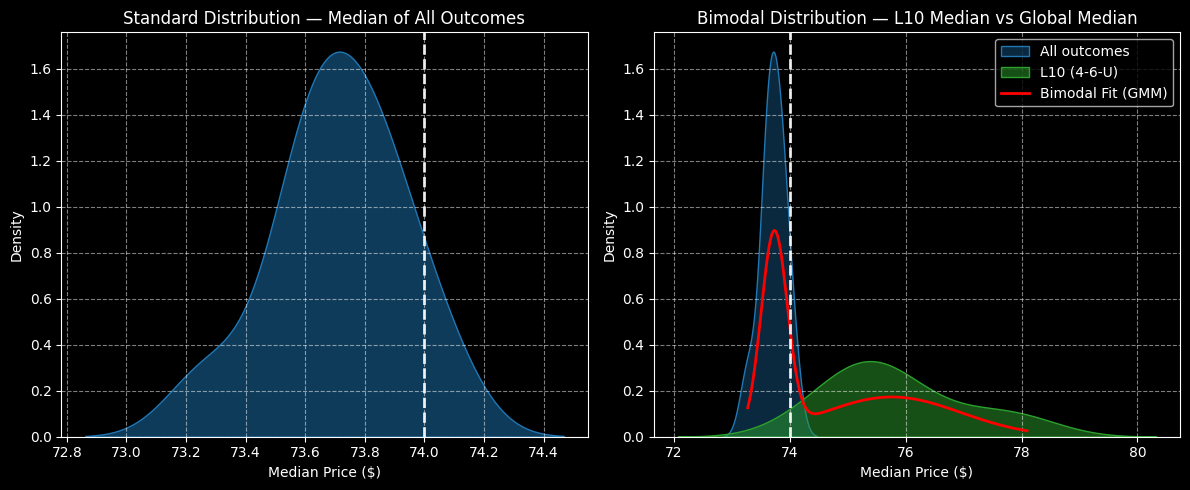
The above assessment aggregates all trials since AST’s public market debut. However, we’re interested in the current quant signal, which is the 4-6-U formation; that is, in the trailing 10 weeks, ASTS stock is on course to print four up weeks and six down weeks, but with an overall upward slope.
Under this signal, the forward 10-week returns should shift to between $72 and $81.20, with price clustering potentially predominant at $75.30. Thus, a positive variance of 2.17% exists between the two clusters, which effectively serves as a form of structural arbitrage.
What’s truly fascinating, though, is not just the probability density but the rate of probability decay. Between $76 and $78, probability density declines on a relative basis by 62.75%. Between $78 and $80, density evaporates by 97.95%. Based on this geometry of risk, then, it behooves us to buy the portion of the distributional curve that is most likely to materialize — and sell the portion that isn’t.

Thanks to the intelligence we collected, it’s my opinion that the 70/80 bull call spread expiring Jan. 16, 2026, represents the most viable trade. While this requires ASTS stock to rise through the second-leg strike at expiration, the breakeven point is $74.80. That’s basically right on the peak of the probabilistic mass, which theoretically means that we should have a decent chance of at least breaking even.
True, the $80 upside target is extremely ambitious. Still, the chances of ASTS stock rising sustainably above $80 are extremely slim. Therefore, the $80 strike also limits our potential opportunity cost.
On the date of publication, Josh Enomoto did not have (either directly or indirectly) positions in any of the securities mentioned in this article. All information and data in this article is solely for informational purposes. For more information please view the Barchart Disclosure Policy here.
More news from Barchart
- The Options Market Is Pricing in Huge Uncertainty for AST SpaceMobile (ASTS): Here’s How to Break the Deadlock
- How to Make a 1.1% Yield Shorting One-Month Microsoft Puts
- Down 8% in December, Investors Should Wait Until Late January to Buy Harley-Davidson
- After a Red-Hot Rally on S&P 500 Inclusion, Carvana Stock Needs a ‘Cool’ Option Collar. How to Trade CVNA Here.


