Innovex International, Inc. (NYSE: INVX) (“Innovex,” the “Company” or “we”) today announced financial and operating results for the third quarter of 2025.
This press release features multimedia. View the full release here: https://www.businesswire.com/news/home/20251103731415/en/
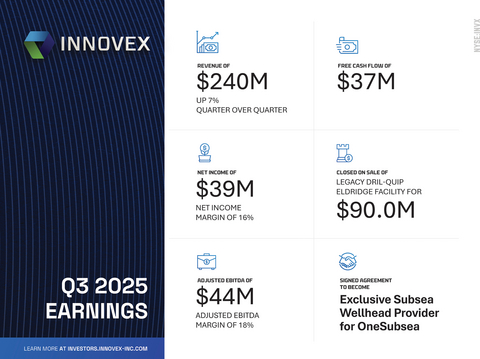
Innovex Announces Third Quarter 2025 Results. Revenue of $240 million, up 7% quarter over quarter.
Third Quarter Highlights
- Revenue of $240 million, up 7% quarter over quarter
- Net Income of $39 million, net income margin of 16%
- Adjusted EBITDA1 of $44 million and Adjusted EBITDA Margin1 of 18%
- Net Cash Provided by Operating Activities of $48 million
- Free Cash Flow1 of $37 million
- Income from Operations of $134 million (twelve months ended September 30, 2025)
- Return on Capital Employed1 of 13%
- Closed on sale of legacy Dril-Quip Eldridge Facility for $90.0 million
- Signed agreement to become exclusive subsea wellhead provider for OneSubsea
(1) |
Adjusted EBITDA, Adjusted EBITDA Margin, Free Cash Flow and Return on Capital Employed (“ROCE”) are non-GAAP measures. Reconciliations of Adjusted EBITDA to net income, Free Cash Flow to net cash provided by operating activities and ROCE to income from operations, the most directly comparable financial measures presented in accordance with GAAP, are outlined in the reconciliation tables accompanying this release. |
Adam Anderson, CEO commented, “In the third quarter the company made significant progress on our key strategic initiatives, which should continue to drive market share gains near term, as well as a step change in margins over the mid-term. We continued to increase our market share in the U.S. Land market after successfully integrating Citadel and outperforming relatively flat US land activity. During the quarter we made significant progress on the transformation of the subsea product line. The closing of the sale of our Eldridge facility is a foundational element of our plan to drive a step change in subsea margins, although facility relocation costs did weigh on margins in the current quarter. On-time delivery for our subsea business continued to improve- achieving 76% in the quarter- with line of sight to legacy Innovex's historical levels in the back half of next year. We expect to substantially exit the Eldrige facility by year end, which will enable further improvement in our operating results in 2026. This operational momentum is driving commercial success- as evidenced by our new partnership with OneSubsea. As the exclusive wellhead provider on bundled subsea packages, Innovex expects to meaningfully grow our already strong position in the subsea wellhead market. These achievements highlight the momentum we are building across the Innovex platform as we continue to execute on our long-term goals of growth, operational excellence, and margin expansion.”
Kendal Reed, CFO continued, “Our capital-light business model and disciplined cost control allowed us to maintain strong free cash flow and healthy margins despite ongoing macro uncertainty. Closing the Eldridge facility sale generated $87 million in net proceeds1 ,further strengthening our net cash position and giving us significant flexibility to pursue high-return opportunities. Our balance sheet strength provides us with optionality as we evaluate a robust M&A pipeline of capital-efficient businesses that align with our stringent requirements. We have remaining authorization to repurchase up to approximately $90.7 million of our shares and continue to evaluate share repurchases against a robust M&A pipeline of capital-efficient businesses that align with our ‘big impact, small ticket’ product strategy.”
| 1 Net proceeds value is defined as final sale price less leaseback and real estate tax prorations, broker fees, and title/escrow fees. |
Financial Summary |
||||||||||||
|
|
Three months ended |
||||||||||
(in thousands) |
|
September 30,
|
|
June 30,
|
|
September 30,
|
||||||
Revenue |
|
$ |
240,000 |
|
|
$ |
224,234 |
|
|
$ |
151,817 |
|
Net Income |
|
|
39,228 |
|
|
|
15,345 |
|
|
|
82,586 |
|
Net Income (Loss) % Revenue |
|
|
16 |
% |
|
|
7 |
% |
|
|
54 |
% |
Adjusted EBITDA (1) |
|
|
43,613 |
|
|
|
46,642 |
|
|
|
27,411 |
|
Adjusted EBITDA Margin (1) |
|
|
18 |
% |
|
|
21 |
% |
|
|
18 |
% |
Net cash provided by operating activities |
|
|
48,374 |
|
|
|
59,210 |
|
|
|
21,722 |
|
Free Cash Flow (1) |
|
|
36,522 |
|
|
|
51,913 |
|
|
|
20,051 |
|
Income from operations |
|
|
62,284 |
|
|
|
22,695 |
|
|
|
(13,218 |
) |
|
|
Twelve Months Ended |
||||||||||
|
|
September 30,
|
|
December 31,
|
|
September 30,
|
||||||
ROCE (1) |
|
|
13 |
% |
|
|
12 |
% |
|
|
9 |
% |
| (1) Adjusted EBITDA, Adjusted EBITDA Margin, Free Cash Flow and Return on Capital Employed (“ROCE”) are non-GAAP financial measures. See definition of these measures and the reconciliation of GAAP to non-GAAP financial measures in the Supplemental Information tables below. |
Operational & Financial Results
Kendal Reed, CFO continued, “We continue to manage supply chains and contracts to minimize any exposure to tariffs. The increase in our SG&A and capex sequentially related primarily to incremental costs associated with the exit of the Eldridge facility and the inclusion of a full quarter of Citadel results. We expect costs related to the Eldridge facility exit to continue into Q4 and expect to be substantially moved out of this legacy facility by the end of the year. As discussed previously, we believe exiting this facility unlocks the first major step in our aspirations of mid 20s EBITDA Margins. Importantly, the near-term costs are far outweighed by the cash proceeds from the sale and the potential for higher margins that is unlocked by a streamlined manufacturing footprint.”
Adam Anderson, CEO concluded, “I am pleased with the market share gains in US land, as well as an improving outlook for our international business. Our differentiated product suite continues to drive value for our customers. In Abu Dhabi, for instance, multiple Innovex technologies were instrumental in drilling a 54,000 foot well - a record for the region. Despite soft activity in Saudi Arabia during the quarter, we have made tangible progress in growing our market position, which we anticipate to be evident in our results by early 2026. We also made significant subsea products deliveries into the Middle East during the quarter. We executed well against our mid-cycle playbook, as we continued growing market share organically, generating cash, and evaluating exciting inorganic opportunities for further, high return growth. We look forward to sharing more in the coming quarters.”
Balance Sheet, Debt, Cash Flow & Other
Net cash provided by operating activities was $48 million and capital expenditures were $12 million (approximately 5% of revenue) for the third quarter of 2025. The incremental increase in capex was primarily related to short-term facility consolidation efforts.
Innovex generated free cash flow of $37 million during the third quarter of 2025 and ended the quarter with $163 million of cash and cash equivalents and $26 million of total debt. Innovex ended the quarter with $132.8 million of availability under its revolving credit facility.
Innovex maintains conservative levels of leverage and ample liquidity to maximize strategic flexibility and to capitalize on M&A opportunities that meet our stringent quantitative and qualitative characteristics.
Return on Capital Employed (“ROCE”)
Innovex’s efficient capital allocation and capital-light business model enable the Company to generate strong returns on our invested capital. Income from operations for the twelve months ended September 30, 2025 was $134 million. Return on Capital Employed (“ROCE”) for the twelve months ended September 30, 2025 was 13%. We remain focused on capital efficiency, which we believe is a key driver of sustainable value creation for our stockholders.
Q4 2025 Guidance
Looking to the fourth quarter of 2025, Innovex expects to generate $235 - $245 million in total revenue. Innovex expects to generate Adjusted EBITDA of $42 - $47 million in the fourth quarter of 2025.
Conference Call Details
Management will host a conference call and a webcast to discuss the financial results on November 4, 2025, at 10:00 a.m. Eastern Daylight Time / 9:00 a.m. Central Daylight Time. The presentation is open to all interested parties and may include forward-looking information. To access the call, please dial in approximately ten minutes before the start of the call.
Date / Time: November 4, 2025 - 9:00 AM Central Time
Webcast: https://events.q4inc.com/attendee/627013927
U.S. Toll-Free Dial-In: (800) 715-9871
International Dial-In: +1 (646) 307-1963
Conference ID: 6263613
For those unable to participate in the live call, an audio replay will be available following the call through midnight Tuesday, November 11, 2025. To access the replay, please call (800) 770-2030 or +1 (609) 800-9909 (International) and enter playback ID 6263613 followed by the # key. A replay of the webcast will also be archived shortly after the call and can be accessed on the Company's website.
About Innovex International, Inc.
Innovex International, Inc (NYSE: INVX) is a Houston-based company established in 2024 following the merger of Dril-Quip, Inc and Innovex Downhole Solutions, Inc.
Our comprehensive portfolio extends throughout the lifecycle of the well, and innovative product integration ensures seamless transitions from one well phase to the next, driving efficiency, lowering cost, and reducing the rig site service footprint for the customer.
With locations throughout North America, Latin America, Europe, the Middle East and Asia, no matter where you need us, our team is readily available with technical expertise, conventional and innovative technologies, and ever-present customer service.
Forward-Looking Statements
Certain statements contained in this press release and oral statements made regarding the matters addressed in this release constitute “forward-looking statements” within the meaning of the Private Securities Litigation Reform Act of 1995. These forward-looking statements are subject to risks, uncertainties and other factors, many of which are outside of Innovex’s control, that could cause actual results to differ materially from the results discussed in the forward-looking statements.
Forward-looking statements can be identified by the use of forward-looking terminology including “may,” “believe,” “expect,” “intend,” “anticipate,” “plan,” “should,” “estimate,” “continue,” “potential,” “will,” “hope” or other similar words and include the Company’s expectation of future performance contained herein. These statements discuss future expectations, contain projections of results of operations or of financial condition, or state other “forward-looking” information, including without limitation statements regarding the expected benefits of the sale of the Eldridge facility. You are cautioned not to place undue reliance on any forward-looking statements, which can be affected by assumptions used or by risks or uncertainties. Consequently, no forward-looking statements can be guaranteed. When considering these forward-looking statements, you should keep in mind the risks related to the Company’s merger and acquisition activities, including the ultimate outcome and results of integrating operations, the effects of the Company’s merger and acquisition activities (including the Company’s future financial condition, results of operations, strategy and plans), potential adverse reactions or changes to business relationships resulting from the completion of mergers and acquisitions, expected benefits from mergers and acquisition and the ability of the Company to realize those benefits, the significant costs required to integrate operations, whether merger or acquisition-related litigation will occur and, if so, the results of any litigation, settlements and investigations, operating hazards, natural disasters, weather-related delays, casualty losses and other matters beyond our control; acts of terrorism, war or political or civil unrest in the United States or elsewhere; loss or corruption of our information or a cyberattack on our computer systems; the risks related to economic conditions and other factors noted in the Company’s Annual Report on Form 10-K, any Quarterly Reports on Form 10-Q and the other documents that the Company files with the Securities and Exchange Commission. The risk factors and other factors noted therein could cause actual results to differ materially from those contained in any forward-looking statement. Innovex disclaims any duty to update and does not intend to update any forward-looking statements, all of which are expressly qualified by the statements in this section, to reflect events or circumstances after the date of this press release, except as may be required by law.
Innovex International, Inc. |
||||||||||||
Condensed Consolidated Statements of Operations and Comprehensive Income |
||||||||||||
(Unaudited) |
||||||||||||
|
||||||||||||
|
|
Three months ended |
||||||||||
(in thousands, except share and per share amounts) |
|
September 30,
|
|
June 30,
|
|
September 30,
|
||||||
Revenues |
|
$ |
240,000 |
|
|
$ |
224,234 |
|
|
$ |
151,817 |
|
Cost of revenues |
|
|
164,057 |
|
|
|
152,515 |
|
|
|
99,138 |
|
Selling, general and administrative expenses |
|
|
35,574 |
|
|
|
28,835 |
|
|
|
37,984 |
|
Gain on sale of assets |
|
|
(40,918 |
) |
|
|
(419 |
) |
|
|
(169 |
) |
Depreciation and amortization |
|
|
15,362 |
|
|
|
14,974 |
|
|
|
7,786 |
|
Impairment of long-lived assets |
|
|
— |
|
|
|
503 |
|
|
|
— |
|
Acquisition and integration costs |
|
|
3,641 |
|
|
|
5,131 |
|
|
|
20,296 |
|
Income from operations |
|
$ |
62,284 |
|
|
$ |
22,695 |
|
|
$ |
(13,218 |
) |
Interest expense |
|
|
677 |
|
|
|
551 |
|
|
|
729 |
|
Other expense (income), net |
|
|
303 |
|
|
|
(92 |
) |
|
|
(269 |
) |
Equity method earnings |
|
|
— |
|
|
|
— |
|
|
|
(1,018 |
) |
Bargain purchase loss/(gain) |
|
|
3,342 |
|
|
|
— |
|
|
|
(92,659 |
) |
Income before income taxes |
|
$ |
57,962 |
|
|
$ |
22,236 |
|
|
$ |
79,999 |
|
Income tax expense/(benefit), net |
|
|
18,734 |
|
|
|
6,891 |
|
|
|
(2,587 |
) |
Net income |
|
$ |
39,228 |
|
|
$ |
15,345 |
|
|
$ |
82,586 |
|
Foreign currency translation adjustment |
|
|
1,314 |
|
|
|
6,728 |
|
|
|
2,457 |
|
Comprehensive income |
|
$ |
40,542 |
|
|
$ |
22,073 |
|
|
$ |
85,043 |
|
Earnings per common share |
|
|
|
|
|
|
|
|
|
|||
Basic |
|
$ |
0.57 |
|
|
$ |
0.22 |
|
|
$ |
2.03 |
|
Diluted |
|
$ |
0.57 |
|
|
$ |
0.22 |
|
|
$ |
1.99 |
|
Weighted average common shares outstanding |
|
|
|
|
|
|
|
|
|
|||
Basic |
|
|
68,814,125 |
|
|
|
68,943,387 |
|
|
|
40,728,902 |
|
Diluted |
|
|
69,265,300 |
|
|
|
69,147,457 |
|
|
|
41,530,978 |
|
Innovex International, Inc. |
||||||||||||
Condensed Consolidated Balance Sheets |
||||||||||||
(Unaudited) |
||||||||||||
|
||||||||||||
(in thousands, except share and par value amounts) |
|
September 30,
|
|
June 30,
|
|
September 30,
|
||||||
Assets |
|
|
|
|
|
|
|
|
|
|||
Current assets |
|
|
|
|
|
|
|
|
|
|||
Cash and cash equivalents |
|
$ |
163,374 |
|
|
$ |
68,781 |
|
|
$ |
99,895 |
|
Trade receivable, net |
|
|
220,408 |
|
|
|
220,966 |
|
|
|
225,067 |
|
Inventories, net |
|
|
275,197 |
|
|
|
278,495 |
|
|
|
297,519 |
|
Other current assets |
|
|
51,373 |
|
|
|
101,863 |
|
|
|
54,851 |
|
Total current assets |
|
|
710,352 |
|
|
|
670,105 |
|
|
|
677,332 |
|
Noncurrent assets |
|
|
|
|
|
|
|
|
|
|||
Property and equipment, net |
|
|
158,685 |
|
|
|
150,670 |
|
|
|
182,230 |
|
Equity method investment |
|
|
— |
|
|
|
— |
|
|
|
19,923 |
|
Goodwill and net intangibles |
|
|
215,863 |
|
|
|
218,864 |
|
|
|
59,719 |
|
Right of use leases - operating, net |
|
|
54,745 |
|
|
|
56,512 |
|
|
|
47,352 |
|
Deferred tax asset, net |
|
|
104,132 |
|
|
|
122,129 |
|
|
|
138,523 |
|
Other long-term assets |
|
|
10,133 |
|
|
|
8,801 |
|
|
|
7,704 |
|
Total noncurrent assets |
|
|
543,558 |
|
|
|
556,976 |
|
|
|
455,451 |
|
Total assets |
|
$ |
1,253,910 |
|
|
$ |
1,227,081 |
|
|
$ |
1,132,783 |
|
Liabilities and stockholders’ equity |
|
|
|
|
|
|
|
|
|
|||
Current liabilities |
|
|
|
|
|
|
|
|
|
|||
Accounts payable |
|
$ |
66,633 |
|
|
$ |
65,321 |
|
|
$ |
83,613 |
|
Accrued expenses |
|
|
45,680 |
|
|
|
48,556 |
|
|
|
55,884 |
|
Operating lease liabilities |
|
|
12,785 |
|
|
|
12,341 |
|
|
|
9,093 |
|
Contract liabilities |
|
|
10,286 |
|
|
|
6,911 |
|
|
|
14,090 |
|
Other current liabilities |
|
|
7,010 |
|
|
|
6,678 |
|
|
|
1,430 |
|
Current portion of long-term debt and finance lease obligations |
|
|
6,316 |
|
|
|
5,938 |
|
|
|
10,695 |
|
Total current liabilities |
|
|
148,710 |
|
|
|
145,745 |
|
|
|
174,805 |
|
Noncurrent liabilities |
|
|
|
|
|
|
|
|
|
|||
Long-term debt and finance lease obligations |
|
|
20,090 |
|
|
|
34,780 |
|
|
|
12,351 |
|
Operating lease liabilities |
|
|
43,287 |
|
|
|
45,634 |
|
|
|
39,314 |
|
Other long-term liabilities |
|
|
2,869 |
|
|
|
5,369 |
|
|
|
1,962 |
|
Total noncurrent liabilities |
|
|
66,246 |
|
|
|
85,783 |
|
|
|
53,627 |
|
Total Liabilities |
|
$ |
214,956 |
|
|
$ |
231,528 |
|
|
$ |
228,432 |
|
Total stockholders’ equity |
|
$ |
1,038,954 |
|
|
$ |
995,553 |
|
|
$ |
904,351 |
|
Total liabilities and stockholders’ equity |
|
$ |
1,253,910 |
|
|
$ |
1,227,081 |
|
|
$ |
1,132,783 |
|
Innovex International, Inc. |
||||||||||||
Condensed Consolidated Statement of Cash Flows |
||||||||||||
(Unaudited) |
||||||||||||
|
||||||||||||
|
|
Three months ended |
||||||||||
(in thousands) |
|
September 30,
|
|
June 30,
|
|
September 30,
|
||||||
Cash flows from operating activities |
|
|
|
|
|
|
|
|
|
|||
Net Income |
|
$ |
39,228 |
|
|
$ |
15,345 |
|
|
$ |
82,586 |
|
Adjustments to reconcile net income to net cash provided by operating activities |
|
|
1,848 |
|
|
|
29,375 |
|
|
|
(71,311 |
) |
Changes in operating assets and liabilities, net of amounts related to acquisitions |
|
|
7,298 |
|
|
|
14,490 |
|
|
|
10,447 |
|
Net cash provided by operating activities |
|
$ |
48,374 |
|
|
$ |
59,210 |
|
|
$ |
21,722 |
|
Cash flows used in investing activities |
|
|
|
|
|
|
|
|
|
|||
Payments on acquisitions, net of cash acquired |
|
|
(500 |
) |
|
|
(63,256 |
) |
|
|
— |
|
Capital expenditures |
|
|
(11,852 |
) |
|
|
(7,297 |
) |
|
|
(1,671 |
) |
Proceeds from sale of property and equipment |
|
|
89,907 |
|
|
|
7,681 |
|
|
|
1,074 |
|
Cash acquired in stock based business combination |
|
|
— |
|
|
|
— |
|
|
|
154,312 |
|
Net cash used in investing activities |
|
$ |
77,555 |
|
|
$ |
(62,872 |
) |
|
$ |
153,715 |
|
Cash flows provided by financing activities |
|
|
|
|
|
|
|
|
|
|||
Net Borrowings (Repayments) on line of credit |
|
|
(29,000 |
) |
|
|
13,400 |
|
|
|
— |
|
Net Repayments on term loan |
|
|
— |
|
|
|
— |
|
|
|
(2,533 |
) |
Payments on Finance Leases |
|
|
(1,793 |
) |
|
|
(1,869 |
) |
|
|
(1,386 |
) |
Dividend payment |
|
|
— |
|
|
|
— |
|
|
|
(74,983 |
) |
Other Financing |
|
|
(384 |
) |
|
|
(9,089 |
) |
|
|
(6,388 |
) |
Net cash provided by (used in) financing activities |
|
$ |
(31,177 |
) |
|
$ |
2,442 |
|
|
$ |
(85,290 |
) |
Effect of exchange rate changes on cash and cash equivalents |
|
|
(159 |
) |
|
|
1,885 |
|
|
|
(608 |
) |
Net change in cash and cash equivalents |
|
$ |
94,593 |
|
|
$ |
665 |
|
|
$ |
89,539 |
|
Non-GAAP Measures
Adjusted EBITDA and Adjusted EBITDA Margin
We define Adjusted EBITDA (a non-GAAP measure) as net income before interest expense, income tax expense, depreciation and amortization, (gain)/loss on sale of assets and other expense, net, further adjusted to exclude certain items which we believe are not reflective of our ongoing performance or which are non-cash in nature. Management uses Adjusted EBITDA to assess the profitability of our business operations and to compare our operating performance to our competitors without regard to the impact of financing methods and capital structure and excluding costs that management believes do not reflect our ongoing operating performance. We track Adjusted EBITDA on an absolute dollar basis and as a percentage of revenue, which we refer to as Adjusted EBITDA Margin.
Free Cash Flow
We also utilize Free Cash Flow (a non-GAAP measure) to evaluate the cash generated by our operations and results of operations. We define Free Cash Flow as net cash provided by operating activities less capital expenditures, as presented in our Consolidated Statements of Cash Flows. Management believes Free Cash Flow is useful because it demonstrates the cash that was available in the period that was in excess of our needs to fund our capital expenditures. We track Free Cash Flow both on an absolute dollar basis and as a percentage of revenue. Free Cash Flow does not represent our residual cash flow available for discretionary expenditures, as we have non-discretionary expenditures, including, but not limited to, principal payments required under the terms of our credit facility, which are not deducted in calculating Free Cash Flow.
Return on Capital Employed (ROCE)
We utilize Return on Capital Employed ("ROCE") (a non-GAAP measure) to assess the effectiveness of our capital allocation over time and to compare our capital efficiency to our competitors. We define ROCE as Income from Operations, before acquisition and integration costs and after tax (resulting in Adjusted Income from Operations, after tax) divided by average capital employed. Capital employed is defined as the combined values of debt and stockholders’ equity.
Adjusted EBITDA, Adjusted EBITDA Margin, Free Cash Flow and ROCE do not represent and should not be considered alternatives to, or more meaningful than, net income and net cash provided by operating activities, or any other measure of financial performance presented in accordance with GAAP as measures of our financial performance. Our computation of Adjusted EBITDA, Free Cash Flow and ROCE may differ from computations of similarly titled measures of other companies. For a reconciliation of these non-GAAP measures to the most directly comparable GAAP measure, see tables below.
Management has provided outlook regarding Adjusted EBITDA, which is a non-GAAP financial measure and excludes certain charges. A reconciliation of this non-GAAP financial measure to the corresponding GAAP financial measure has not been provided because guidance for the various reconciling items is not provided. The Company is unable to provide guidance for these reconciling items because they cannot determine their probable significance, as certain items are outside of the Company's control and cannot be reasonably predicted since these items could vary significantly from period to period. Accordingly, reconciliations to the corresponding GAAP financial measures are not available without unreasonable effort.
Innovex International, Inc. |
||||||||||||
Reconciliation of Net Income to Adjusted EBITDA |
||||||||||||
(Unaudited) |
||||||||||||
|
||||||||||||
|
|
Three months ended |
||||||||||
(in thousands) |
|
September 30,
|
|
June 30,
|
|
September 30,
|
||||||
Revenue |
|
$ |
240,000 |
|
|
$ |
224,234 |
|
|
$ |
151,817 |
|
Net Income |
|
|
39,228 |
|
|
|
15,345 |
|
|
|
82,586 |
|
Interest expense |
|
|
677 |
|
|
|
551 |
|
|
|
729 |
|
Income tax expense/(benefit), net |
|
|
18,734 |
|
|
|
6,891 |
|
|
|
(2,587 |
) |
Depreciation and amortization |
|
|
15,362 |
|
|
|
14,974 |
|
|
|
7,786 |
|
EBITDA |
|
$ |
74,001 |
|
|
$ |
37,761 |
|
|
$ |
88,514 |
|
Other non-operating income, net (1) |
|
|
303 |
|
|
|
(92 |
) |
|
|
(269 |
) |
(Gain)/Loss on sale of assets |
|
|
(40,918 |
) |
|
|
(419 |
) |
|
|
(169 |
) |
Impairment of long-lived assets |
|
|
— |
|
|
|
503 |
|
|
|
— |
|
Acquisition and integration costs (2) |
|
|
3,641 |
|
|
|
5,131 |
|
|
|
20,296 |
|
Equity Method Adjustment (3) |
|
|
— |
|
|
|
— |
|
|
|
790 |
|
Bargain purchase loss/(gain) |
|
|
3,342 |
|
|
|
— |
|
|
|
(92,659 |
) |
Stock based compensation |
|
|
3,244 |
|
|
|
3,758 |
|
|
|
10,908 |
|
Adjusted EBITDA |
|
$ |
43,613 |
|
|
$ |
46,642 |
|
|
$ |
27,411 |
|
Net Income (Loss) % Revenue |
|
|
16 |
% |
|
|
7 |
% |
|
|
54 |
% |
Adjusted EBITDA Margin |
|
|
18 |
% |
|
|
21 |
% |
|
|
18 |
% |
| (1) Primarily represents foreign currency exchange gain/loss, gain/loss on lease terminations, and other non-operating items. | ||||||||||||
| (2) Consists of legal, accounting, advisory fees, and other integration costs associated with acquisitions, primarily related to Dril-Quip, DWS, SCF and Citadel. These costs are one-time in nature and represent expenses that we do not view as normal operating expenses necessary to operate our business. | ||||||||||||
| (3) Reflects the elimination of our percentage of interest expense, depreciation, amortization and other non-recurring expenses included within equity method earnings pertaining to our unconsolidated investment in DWS. |
Innovex International, Inc. |
||||||||||||
Reconciliation of Income from Operations to ROCE |
||||||||||||
(Unaudited) |
||||||||||||
|
||||||||||||
|
|
Twelve Months Ended |
||||||||||
(in thousands) |
|
September 30,
|
|
December 31,
|
|
September 30,
|
||||||
Income from operations |
|
$ |
133,741 |
|
|
$ |
49,075 |
|
|
$ |
45,465 |
|
Plus: Acquisition and integration costs |
|
|
20,868 |
|
|
|
33,300 |
|
|
|
25,834 |
|
Less: Income tax expense |
|
|
(27,857 |
) |
|
|
(2,487 |
) |
|
|
(11,901 |
) |
Adjusted income from operations, after tax |
|
$ |
126,752 |
|
|
$ |
79,888 |
|
|
$ |
59,398 |
|
Beginning debt |
|
|
23,046 |
|
|
|
50,390 |
|
|
|
69,997 |
|
Beginning equity |
|
|
904,351 |
|
|
|
328,921 |
|
|
|
307,946 |
|
Ending debt |
|
|
26,406 |
|
|
|
35,368 |
|
|
|
23,046 |
|
Ending equity |
|
|
1,038,954 |
|
|
|
958,156 |
|
|
|
904,351 |
|
Average capital employed |
|
$ |
996,379 |
|
|
$ |
686,418 |
|
|
$ |
652,670 |
|
ROCE |
|
|
13 |
% |
|
|
12 |
% |
|
|
9 |
% |
Innovex International, Inc. |
||||||||||||
Reconciliation of Net Cash from Operations to Free Cash Flow |
||||||||||||
(Unaudited) |
||||||||||||
|
||||||||||||
|
|
Three months ended |
||||||||||
(in thousands) |
|
September 30,
|
|
June 30,
|
|
September 30,
|
||||||
Net cash provided by operating activities |
|
$ |
48,374 |
|
|
$ |
59,210 |
|
|
$ |
21,722 |
|
Capital expenditures |
|
|
(11,852 |
) |
|
|
(7,297 |
) |
|
|
(1,671 |
) |
Free Cash Flow |
|
$ |
36,522 |
|
|
$ |
51,913 |
|
|
$ |
20,051 |
|
Innovex International, Inc. |
||||||||||||
Geographic Revenue Details |
||||||||||||
(Unaudited) |
||||||||||||
|
||||||||||||
|
|
Three months ended |
||||||||||
(in thousands) |
|
September 30,
|
|
June 30,
|
|
September 30,
|
||||||
North America Onshore ("NAM") |
|
|
|
|
|
|
|
|
|
|||
Product revenues |
|
$ |
86,597 |
|
|
$ |
77,368 |
|
|
$ |
79,668 |
|
Rental revenues |
|
|
28,114 |
|
|
|
26,698 |
|
|
|
5,228 |
|
Service revenues |
|
|
17,218 |
|
|
|
15,901 |
|
|
|
13,411 |
|
Revenue - North America Onshore |
|
|
131,929 |
|
|
|
119,967 |
|
|
|
98,307 |
|
International & Offshore |
|
|
|
|
|
|
|
|
|
|||
Product revenues |
|
|
79,205 |
|
|
|
72,081 |
|
|
|
46,975 |
|
Rental revenues |
|
|
14,274 |
|
|
|
17,305 |
|
|
|
4,172 |
|
Service revenues |
|
|
14,592 |
|
|
|
14,881 |
|
|
|
2,363 |
|
Revenue - International & Offshore |
|
|
108,071 |
|
|
|
104,267 |
|
|
|
53,510 |
|
Total Revenue |
|
$ |
240,000 |
|
|
$ |
224,234 |
|
|
$ |
151,817 |
|
View source version on businesswire.com: https://www.businesswire.com/news/home/20251103731415/en/
"These achievements highlight the momentum we are building across the Innovex platform as we continue to execute on our long-term goals of growth, operational excellence, and margin expansion.” Adam Anderson, President & CEO
Contacts
Investor Relations Contact
Avinash Cuddapah
Sr. Director – Investor Relations
investors@innovex-inc.com
(346) 398-0000


