BBB Foods Inc. (“Tiendas 3B” or the “Company”) (NYSE: TBBB), a leading grocery hard discounter in Mexico, announced today its consolidated results for the fourth quarter of 2025 (“4Q25”) and for the year ended December 31, 2025. The figures presented in this release are expressed in nominal Mexican Pesos (Ps.) and are prepared in accordance with International Financial Reporting Standards (“IFRS”), unless otherwise stated.
This press release features multimedia. View the full release here: https://www.businesswire.com/news/home/20260311242268/en/
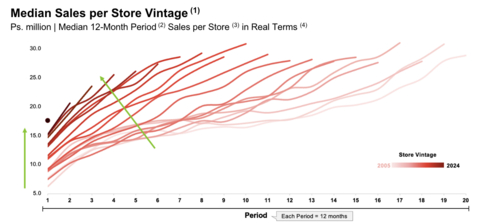
STORE PERFORMANCE BY VINTAGE Source: Company Information. INEGI Notes: 1.“Sales Ramp-up Evolution by Vintage” measures, for stores of the same vintage, the median of such stores’ revenue from sales of merchandise during 12-month periods since the start of operation. When calculating this measure, we exclude the first calendar month of a store’s operations to account for stores that are not open for the entire month, as well as stores that have been permanently closed. Considers stores opened in the corresponding vintage that remained open as of December 2025 2.12-month period since opening, excludes month 1 3.Median 12-month period sales of all stores opened in the corresponding vintage (excludes first month to “normalize” dates in which stores are operational since opening). Closed stores are excluded from median calculation. 4.All figures in real Ps. terms as of December 31, 2025, adjusted for inflation using Mexican National Consumer Price Index (Índice Nacional de Precios al Consumidor), as provided by INEGI and as published by the Mexican Central Bank
HIGHLIGHTS
FOURTH qUARTER 2025
- Opened 184 net new stores during the quarter, reaching 3,346 units as of December 31, 2025.
- Opened two distribution centers in 4Q25, reaching 20 as of December 31, 2025.
-
Ps. 21,972 million total revenue for 4Q25.
- 34.4% revenue growth compared to 4Q24.
- Same Store Sales grew 16.6% compared to 4Q24.
-
EBITDA was Ps. 79 million in 4Q25, compared to Ps. 845 million in 4Q24.
- Excluding non-cash share-based payment expense of Ps. 891 million and a one-time write-off of an account receivable of Ps. 230 million relating to the termination of our payment terminal provider, EBITDA reached Ps. 1,200 million, an increase of 23.5% compared to 4Q24. Please refer to the Additional Disclosures section for further details.
FULL YEAR 2025
- Opened 574 net new stores during 2025, a 21% expansion compared to 2024.
- Opened four distribution centers in 2025.
-
Ps. 78,153 million in total revenue for the full year.
- 36.1% total revenue growth compared to 2024.
- Same Store Sales growth of 18.3% compared to 2024.
-
EBITDA was Ps. 1,224 million, compared to Ps. 2,847 million in 2024.
- Excluding non-cash share-based payment expense, as well as the one-time write-account receivable off recorded in 4Q25, EBITDA reached Ps. 4,384 million, an increase of 30.1% compared to 2024.
- Negative working capital was Ps. 8,939 million.
- Cash flow from operations increased by 24.9%.
MESSAGE FROM THE CHAIRMAN AND CEO
Dear Investors,
Our strategy of rapidly expanding a highly efficient store network while continuously improving value for customers delivered another year of strong growth and operating performance.
In 2025, we opened 574 net new stores, a 21% increase relative to 2024, bringing our total store count to 3,346, and exceeding our guidance of 500 to 550 net store openings for the year. We also opened four new distribution centers during 2025, bringing the total to 20.
Our sales performance was notable. Total revenue in 2025 reached Ps. 78,153 million, up 36.1% vs. 2024, and Same Store Sales reached 18.3%. The ongoing improvement of our value proposition to consumers, disciplined execution, and the relentless scaling of our store base drove market share gains. Our private label penetration increased to 58.2% of revenues in 2025, compared to 53.6% in 2024.
EBITDA, excluding the impact of the non-cash share-based payment and a one-time account receivable write-off recorded in 4Q25, for 2025 reached Ps. 4,384 million, representing a growth of 30.1% year over year. Reported EBITDA was Ps. 1,224 million and includes the impact of the non-cash share-based payment and a one-time account receivable write-off recorded in 4Q25.
While EBITDA margin is an important metric, we do not manage the business to achieve a specific margin target in any given quarter. Instead, we focus on executing our core priorities: opening successful stores, continuously improving value for our customers, and operating with increasing efficiency. Over time, we expect this disciplined approach to translate into expanding margins. We believe this approach creates long-term shareholder value and sustainable competitive advantages. Cash generation is also important. Our model benefits from negative working capital dynamics, driven by strong sales growth and rapid inventory turnover, which support healthy cash flow.
We closed 2025 with strong momentum. In 4Q25, revenue reached Ps. 21,972, up 34.4% vs 4Q24, while Same Store Sales grew 16.6%. We accelerated our store opening pace, adding 184 net new stores during the quarter. Adjusted for share-based payment and the one-time account receivable write-off, 4Q25 EBITDA grew 23.5% compared with 4Q24.
Our business model is robust and continues to strengthen as we scale. By consistently improving the value we offer our customers, we are becoming more efficient and more competitive. Our business model is also relatively resilient to economic cycles. We serve essential needs that tend to remain stable over time.
Looking ahead to 2026 and beyond, we will continue to do the same: just faster and better.
Thank you for your continued trust and support.
K. Anthony Hatoum, Chairman and Chief Executive Officer
FINANCIAL RESULTS
4Q25 CONSOLIDATED RESULTS |
||||||
(In Ps. Million, except percentages) |
||||||
4Q25 |
As % of
|
4Q24 |
As % of
|
Growth (%) |
Margin
|
|
Total Revenue |
Ps. 21,972 |
100.0% |
Ps. 16,347 |
100.0% |
34.4% |
n.m. |
Gross Profit |
Ps. 3,580 |
16.3% |
Ps. 2,698 |
16.5% |
32.7% |
(21 bps) |
Sales Expenses |
(Ps. 2,317) |
10.5% |
(Ps. 1,913) |
11.7% |
21.1% |
(116 bps) |
Administrative Expenses |
(Ps. 1,549) |
7.1% |
(Ps. 561) |
3.4% |
176.4% |
362 bps |
Other Income – Net |
(Ps. 200) |
0.9% |
Ps. 54 |
0.3% |
n.m. |
(124 bps) |
EBITDA |
Ps. 79 |
0.4% |
Ps. 845 |
5.2% |
n.m. |
n.m. |
Share-based payment expense |
Ps. 891 |
4.1% |
Ps. 127 |
0.8% |
n.m. |
n.m. |
EBITDA ex. SBP & One-Time Account Receivable Write-Off |
Ps. 1,200 |
5.5 % |
Ps. 972 |
5.9% |
23.5% |
(48 bps) |
Please see the explanation at the end of this release on how EBITDA, a non-IFRS financial measure, is calculated, and for other relevant definitions. |
||||||
TOTAL REVENUE
Total revenue for 4Q25 was Ps. 21,972 million, up 34.4% year-over-year. Most of this growth was driven by sales from stores that have been operating for more than one year, and, to a lesser extent, the incremental sales from 574 net new stores opened in 2025.
GROSS PROFIT AND GROSS PROFIT MARGIN
Gross profit for 4Q25 was Ps. 3,580 million, an increase of 32.7% compared to 4Q24. This increase reflected sales growth and a 21-bps contraction in gross margin. Our commercial margin remains healthy and stable year-over-year. The modest gross margin contraction was primarily related to incremental logistic costs associated with the opening of four distribution centers in the second half of 2025.
EXPENSES
Sales expenses primarily reflect the cost of operating our stores, including wages and energy. In 4Q25, sales expenses reached Ps. 2,317 million, a 21.1% increase compared to 4Q24. This growth was mainly driven by an increase in utilities and maintenance-related expenses, while most of other expenses (including labor) grew at a slower pace than revenue. As a percentage of total revenue, sales expenses decreased from 11.7% in 4Q24 to 10.5% in 4Q25, a contraction of 116 bps. Part of this contraction is explained by a one-time adjustment in depreciation and amortization (“D&A”) charges recorded in 4Q24.
Administrative expenses refer to expenses not directly related to operating our stores, such as headquarters, regional office expenses, and share-based compensation. For 4Q25, administrative expenses totaled Ps. 1,549 million, a 176.4% increase compared to 4Q24. This increase reflected (i) higher non-cash share-based payment expense, including the recognition of the Liquidity Event Plan (LEP) disclosed in February 2024 and granted by the Board of Directors in June 2025, subject to a quarterly vesting schedule (see Appendix 2 of this Earnings Release for additional details); (ii) increased staffing expenses for the new regional operations; and (iii) continued investments in human capital. As a percentage of revenue, administrative expenses increased from 3.4% in 4Q24 to 7.1% in 4Q25. The non-cash share-based compensation is reflected in our fully diluted share count.
Excluding non-cash share-based payment expense, administrative expenses for 4Q25 amounted to Ps. 658 million, an increase of 51.9% compared to 4Q24. As a percentage of revenue, administrative expenses excluding non-cash share-based payment expense stood at 3.0% in 4Q25, an increase of 35 bps from 4Q24.
Please refer to Appendix 2 of this Earnings Release for an updated table summarizing the share-based payment expense plans and related expenses.
Other (expense) income - net, which includes, among other items, revenues (expenses) from non-operative activities such as asset disposals, cost reimbursements, and insurance proceeds, amounted to a net expense of Ps. 200 million in 4Q25, compared to a net income of Ps. 54 million in 4Q24. The amount recorded in 4Q25 reflected the commented one-time account receivable write-off. As a percentage of revenue, other (expense) income– net decreased by 124 bps.
EBITDA AND EBITDA MARGIN
For 4Q25, EBITDA was Ps. 79 million, compared to Ps. 845 million in 4Q24. As previously described, our EBITDA was impacted by the increase in non-cash share-based payment expense as well as by a one-time account receivable write-off.
Excluding non-cash share-based payment expense as well as the one-time account receivable write-off, EBITDA was Ps. 1,200 million, an increase of 23.5% compared to 4Q24. The EBITDA margin for 4Q25, adjusted to add-back non-cash share-based compensation and the one-time account receivable write-off, decreased by 48 bps to 5.5%.
Please see the last section of this release on how we calculate EBITDA and EBITDA Margin, which are non-IFRS financial measures.
ADDITIONAL DISCLOSURES
To allow investors to better assess our performance, the Company is providing the following supplementary information:
- Share-based payment expense (non-cash): Non-cash share-based payment expense totaled Ps. 891 million in 4Q25, compared to Ps. 127 million recorded in 4Q24. Of the 4Q25 expense, Ps. 708 million relates to pre-IPO allocations. For additional details, please refer to Appendix 2 of this Earnings Release.
- Building lease payments: The Company leases all except one of its stores and all of its distribution centers. In accordance with IFRS 16, the Company’s lease expenses are capitalized, and are not considered operating expenses. Tiendas 3B’s capitalized lease payments for buildings were Ps. 533 million in 4Q25, compared to Ps. 378 million in 4Q24.
- One-time account receivable write-off: In 4Q25, the Company terminated its relationship with its payment terminal provider. At that time, the outstanding accounts receivable balance with the provider totaled Ps. 230 million, which the Company fully wrote off during the quarter, resulting in a one-time impact on earnings. The Company is pursuing legal remedies in connection with this matter. Payment processing has since been migrated to terminals operated by one of the top three banks in Mexico, with no disruption to operations.
FINANCIAL COSTS AND NET LOSS
Financial income totaled Ps. 41 million in 4Q25, down from Ps. 46 million in 4Q24. The decrease was primarily driven by lower interest rates.
Financial costs were Ps. 447 million for 4Q25, a 34.3% increase compared to 4Q24. This increase was primarily driven by higher interest expense on lease liabilities, reflecting the continued expansion of our stores and distribution center network.
The Company recorded a foreign exchange loss of Ps. 73 million in 4Q25, driven by the depreciation of the U.S. dollar against the Mexican peso, which negatively impacted in Mexican Peso terms the Company’s U.S. dollar-denominated cash position still held from the IPO.
Income tax expense reached Ps. 77 million in 4Q25 compared to Ps. 120 million in 4Q24.
As a result, our net loss for 4Q25 was Ps. 1,043 million, compared to a net loss of Ps. 24 million for 4Q24.
FULL YEAR 2025 CONSOLIDATED RESULTS |
||||||
(In Ps. Million, except percentages) |
||||||
|
2025 |
As % of
|
2024 |
As % of
|
Growth (%) |
Margin
|
Total Revenue |
Ps. 78,153 |
100.0% |
Ps. 57,439 |
100.0% |
36.1% |
n.m. |
Gross Profit |
Ps. 12,643 |
16.2% |
Ps. 9,376 |
16.3% |
34.8% |
(15 bps) |
Sales Expenses |
(Ps. 8,123) |
10.4% |
(Ps. 6.122) |
10.7% |
32.7% |
(26 bps) |
Administrative Expenses |
(Ps. 5,094) |
6.5% |
(Ps. 1,987) |
3.5% |
156.4% |
306 bps |
Other Income – Net |
(Ps. 101) |
0.1% |
Ps. 61 |
0.1% |
n.m. |
(24 bps) |
EBITDA |
Ps. 1,224 |
1.6% |
Ps. 2,847 |
5.0% |
(57.0%) |
(339 bps) |
Share-based payment expense |
Ps. 2,930 |
3.7% |
Ps. 523 |
0.9% |
460.0% |
284 bps |
EBITDA ex. SBP & One-Time Account Receivable Write-Off |
Ps. 4,384 |
5.6% |
Ps. 3,370 |
5.9% |
30.1% |
(26 bps) |
Please see the explanation at the end of this release on how EBITDA, a non-IFRS financial measure, is calculated, and for other relevant definitions. |
||||||
TOTAL REVENUE
Total revenue for 2025 was Ps. 78,153 million, up 36.1% year-over-year. In 2025, sales growth was primarily driven by a 23.0% increase in the number of transactions, which increased to 825 million from 671 million in 2024. The average ticket also increased, from Ps. 85.4 to Ps. 94.9, a gain of 11.0%, mostly driven by an increase in items per ticket. Most of this growth was driven by sales from stores that have been operating for more than one year, and, to a lesser extent, the incremental sales from 574 net new stores opened in 2025.
GROSS PROFIT AND GROSS PROFIT MARGIN
Gross profit for 2025 was Ps. 12,643 million, an increase of 34.8% compared to 2024. This increase reflected sales growth and a 15-bps contraction in gross margin, entirely caused by the higher logistic costs associated with the opening of four distribution centers in 2025.
EXPENSES
In 2025, sales expenses reached Ps. 8,123 million, a 32.7% increase compared to 2024. This growth was mainly driven by an increase in D&A charges, maintenance, utilities, and, to a lesser extent, labor-related expenses due to our larger store base. As a percentage of total revenue, sales expenses decreased from 10.7% in 2024 to 10.4% in 2025, a reduction of 26 bps.
Administrative expenses totaled Ps. 5,094 million in 2025, a 156.4% increase compared to 2024. This increase reflected (i) higher non-cash share-based payment expense, including the start of the recognition of the Liquidity Event Plan (LEP) disclosed in February 2024 and granted by the Board of Directors in June 2025, subject to a quarterly vesting schedule (see Appendix 2 of this Earnings Release for additional details); (ii) increased staffing expenses for the new regional operations; and (iii) continued investments in human capital. As a percentage of revenue, administrative expenses increased from 3.5% in 2024 to 6.5% in 2025. As previously explained, the non-cash share-based compensation is reflected in our fully diluted share count.
Excluding non-cash share-based payment expense, administrative expenses for 2025 amounted to Ps. 2,111 million, an increase of 51.4% compared to 2024. As a percentage of revenue, administrative expenses excluding non-cash share-based payment expense stood at 2.7% in 2025, an increase of 27 bps from 2024.
Please refer to Appendix 2 of this Earnings Release for an updated table summarizing the share-based payment expense plans and related expenses.
Other (expense) income - net, which includes, among other items, revenues (expenses) from non-operative activities such as asset disposals, cost reimbursements, and insurance proceeds, amounted to an expense of Ps. 101 million in 2025, compared to a net income of Ps. 61 million in 2024. As a percentage of revenue, other (expense) income– net decreased by 24 bps.
EBITDA AND EBITDA MARGIN
For 2025, EBITDA was Ps. 1,224 million, compared to a Ps. 2,847 million gain in 2024. As previously described, our EBITDA margin was impacted by the increase in non-cash share-based payment expense and the one-time account receivable write-off in 4Q25.
Excluding non-cash share-based payment expense as well as the one-time account receivable write-off, EBITDA was Ps. 4,384 million, an increase of 30.1% compared to 2024. The EBITDA margin for 2025, adjusted to add-back non-cash share-based compensation and the one-time account receivable write-off, contracted by 26 bps to 5.6%.
Please see the last section of this release on how we calculate EBITDA and EBITDA Margin, which are non-IFRS financial measures.
FULL YEAR 2025 ADDITIONAL DISCLOSURES
To allow investors to better assess our performance, the Company is providing the following supplementary information:
- Non-cash Share-based payment expense reached Ps. 2,930 million in 2025, compared to Ps. 523 million recorded in 2024. For additional details, please refer to Appendix 2 section of this Earnings Release.
- Building lease payments: The Company leases all except one of its stores and all of its distribution centers. In accordance with IFRS 16, the Company’s lease expenses are capitalized, and are not considered operating expenses. Tiendas 3B’s capitalized lease payments for buildings were Ps. 1,833 million in 2025, compared to Ps. 1,389 million in 2024.
- One-time account receivable write-off: Please refer to the previous discussion on the topic in the Additional Disclosures section for 4Q25.
FINANCIAL COSTS AND NET LOSS
Financial income totaled Ps. 173 million in 2025, up from Ps. 156 million in 2024. The increase was primarily driven by interest earned on the net cash proceeds from the Company’s Initial Public Offering in 2024 (“IPO”).
Financial costs were Ps. 1,508 million for 2025, a 20.0% increase compared to 2024. This increase was primarily driven by higher interest on lease liabilities, reflecting the continued expansion of our stores and distribution center network.
The Company recorded a foreign exchange loss of Ps. 385 million in 2025, driven by the depreciation of the U.S. dollar against the Mexican peso, which negatively impacted, in Mexican Peso terms, the Company’s U.S. dollar-denominated cash position still held from the IPO.
Income tax expense reached Ps. 444 million in 2025 compared to Ps. 383 million in 2024.
As a result, our net loss for 2025 was Ps. 2,840 million, compared to a net profit of Ps. 334 million for 2024.
BALANCE SHEET AND LIQUIDITY
As of December 31, 2025, the Company had local currency cash and cash equivalents of Ps. 1,427 million. In addition, as of December 31, 2025, the Company held $151 million in U.S. dollar-denominated short-term bank deposits. The Company applied an exchange rate of Ps. 17.97 to one U.S. dollar as of December 31, 2025.
CASH FLOW STATEMENT |
|||
(In Ps. Million, except percentages) |
|||
2025 |
2024 |
Growth (%) |
|
Net cash flows provided by operating activities |
Ps. 4,682 |
Ps. 3,749 |
24.9% |
Net cash flows used in investing activities |
Ps. (3,409) |
(Ps. 4,907) |
(30.5%) |
Net cash flows obtained from (used in) financing activities |
Ps. (1,254) |
Ps. 1,228 |
n.m. |
Net decrease in cash and cash equivalents |
Ps. 18 |
Ps. 129 |
n.m. |
Our business model continues to generate strong operating cash flow from our negative working capital cycle due to our growing sales and high inventory turnover relative to payment terms. This robust cash flow has enabled us to fund our growth initiatives, including the expansion of new stores and distribution centers internally.
The information provided below summarizes cash flow changes in 2025:
Net cash flows provided by operating activities increased to Ps. 4,682 million for 2025 from Ps. 3,749 million for 2024. Our net working capital continues to be driven by a favorable ratio of Inventory Days to Payable Days.
Net cash flows used in investing activities totaled Ps. 3,409 million for 2025, compared to Ps. 4,907 million in 2024. This decrease was primarily driven by the Ps. 2,621 million allocation of IPO proceeds into short-term deposits during 2024, partially offset by continued investments to expand our store and logistics network.
Net cash flows used in financing activities were Ps. 1,254 million for 2025, compared to the cash flows obtained in 2024 of Ps. 1,228 million. The year-over-year difference primarily reflected the net proceeds from the IPO received in 2024.
KEY ANNUAL OPERATING METRIC |
|||
2025 |
2024 |
Variation (%) |
|
Number of Stores Opened |
574 |
484 |
18.6% |
Number of Distribution Centers |
20 |
16 |
25.0% |
Same Store Sales Growth (%) |
18.3% |
13.4% |
n.m. |
Private Label Sales Products (% of Sales of Merchandise) |
58.2% |
53.6% |
460 bps |
Average Ticket Size(1) |
Ps. 94.9 |
Ps. 85.4 |
11.0% |
Transaction Number(2) |
27,494 |
26,821 |
2.5% |
(1) |
|
We calculate “average ticket size” by dividing revenue from Sales of Merchandise by the total number of transactions. |
(2) |
|
Number of transactions is derived from stores that have been operating for 5+ years. |
During 2025, we opened 574 stores compared to the 484 stores opened in 2024. In 4Q25, we opened 184 stores. To support the incremental number of stores, in 2025, we opened four additional distribution centers.
Same Store Sales grew by 16.6% for 4Q25, compared to 11.8% for 4Q24. For the year 2025, Same Store Sales increased by 18.3%, compared to 13.4% for 2024.
Our private label offering continues to gain as a share of sales of merchandise. The share of revenue from private labels increased from 53.6% in 2024 to 58.2% in 2025.
STORE PERFORMANCE BY VINTAGE
Our Sales per Store curves have shown a consistent upward trend across store vintages from 2005 to 2024. The data, adjusted for inflation, reflects growing sales maturity over time, with earlier vintages becoming more productive over time. The charts above demonstrate our disciplined approach to store expansion, with new stores not negatively impacting the sales of older stores (indeed, on the contrary).
2026 GUIDANCE
|
Range |
Same Store Sales Growth (%) |
13% - 16% |
Revenue Growth (%) |
29% - 32% |
Number of New Stores |
590 - 630 |
For 2026, the Company plans to open between 590 and 630 stores during the year. We expect Same Store Sales growth between 13% and 16%, and total revenue is forecast to grow by 29% to 32%.
This guidance is predicted on the prevailing consensus regarding the outlook for the Mexican economy and is subject to change, particularly if Mexico’s economic performance deviates from current expectations.
Disclaimer
The foregoing 2026 guidance reflects management’s current assumptions regarding numerous evolving factors that are difficult to accurately predict, including those discussed in the “Risk Factors” section set forth in the Company’s Registration Statement on Form F-1 filed with the U.S. Securities and Exchange Commission (the “SEC”) and the Company’s Annual Report on Form 20-F to be filed with the SEC.
A reconciliation of the forward-looking non-IFRS measure, specifically the 2025 EBITDA Margin guidance, to the relevant forward-looking IFRS measure is not being provided, as the Company does not currently have sufficient data to accurately estimate the variables and individual adjustments for such guidance and reconciliation. Due to this uncertainty, the Company cannot reconcile projected EBITDA Margin to projected net profit/loss without unreasonable effort.
The 2026 guidance constitutes forward-looking statements. For more information, see “Forward-Looking Statements” in this release.
Non-IFRS Measures and Other Calculations
For the convenience of investors, this release presents certain non-IFRS financial measures, which are not calculated in accordance with IFRS (“non-IFRS financial measures”). A non-IFRS financial measure is generally defined as one that purports to measure financial performance but excludes or includes amounts that would not be so excluded or included in the most comparable IFRS financial measure. Non-IFRS financial measures do not have standardized meanings and may not be directly comparable to similarly titled measures reported by other companies. These non-IFRS financial measures are used by our management for decision-making purposes and to assess our financial and operating performance, generate future operating plans and make strategic decisions regarding the allocation of capital. The non-IFRS financial measures presented herein have limitations as analytical tools, and you should not consider them in isolation or as substitutes for analysis of our results of operations presented in accordance with IFRS. Additionally, our calculations of non-IFRS financial measures may be different from the calculations used by other companies, including our competitors, and therefore, our non-IFRS financial measures may not be comparable to those of other companies.
We calculate “EBITDA”, a non-IFRS measure, as net profit (loss) for the period, plus income tax expense, financial costs, net, and total depreciation and amortization.
We calculate “EBITDA Margin”, a non-IFRS measure, for a period by dividing EBITDA for the corresponding period by total revenue for such period.
Same Store Sales: We measure “Same Store Sales” using revenue from sales of merchandise at stores that were operational for at least the full preceding 12 months for the periods under consideration. Stores that were temporarily closed (for one month or more) or permanently closed during the relevant measurement periods are excluded from this metric. Same Store Sales growth is calculated by comparing the Same Store Sales of stores that were opened and remained open throughout the relevant measurement period.
Lease Costs: Consistent with lease accounting required under IFRS 16, total depreciation and amortization includes the depreciation expense of right-of-use-asset corresponding to long-term leases, which is a non-cash expense. Such amounts, together with the interest expense on lease liabilities, is a proxy for but not equal to the Company’s actual cash expenditure incurred in connection with its leased properties.
Sales per Store: We define our “Sales per Store” as the average of the revenue from sales of merchandise achieved by our stores that were open for the full year in consideration. When calculating this measure, we exclude stores that were temporarily closed (for one month or more) or permanently closed during the period in consideration. This measure assists our management’s understanding of how store performance has evolved across different vintages. Sales per Store also serves as a benchmark to measure the performance of new stores and is useful to set growth and expansion targets.
Inventory Days: We calculate “Inventory Days” to be the average of beginning and end of period inventory balance, divided by cost of sales for the period and multiplied by the number of days during the period. Inventory Days measures the average number of days we keep inventory on hand before selling the product. This operating metric allows us to track our inventory management policies and observe how quickly we are able to rotate inventory, which is key to our cash conversion cycle.
Payable Days: We calculate “Payable Days” to be the sum of the average of beginning and end of period balance of suppliers and of accounts payable and accrued expenses, divided by cost of sales for the period and multiplied by the number of days during the period. Payable Days measures the average number of days that it takes us to pay suppliers after receiving goods or services. This metric allows us to track the terms of payment policies with suppliers and our ability to finance our operations through agreements with our suppliers.
CONFERENCE CALL DETAILS
Tiendas 3B will host a call to discuss the fourth quarter and full year 2025 results on March 12th, 2026, at 12:00 p.m. Eastern Time (10:00 a.m. Mexico City time). A webinar of the call will be accessible at:
https://zoom.us/webinar/register/WN_n3iHgoaHQJWuxckAjgW6Ug
To join via telephone, please dial one of the domestic or international numbers listed below:
Mexico |
United States |
|||
+52 558 659 6002 |
+1 312 626 6799 (Chicago) |
|||
+52 554 161 4288 |
+1 346 248 7799 (Houston) |
|||
+52 554 169 6926 |
+1 646 558 8656 (New York) |
Other international numbers available: https://us02web.zoom.us/u/knEOJCJkC
The webinar ID is 958 8843 0066
An audio replay from the conference call will be available on the Tiendas 3B website https://www.investorstiendas3b.com after the call.
FORWARD-LOOKING STATEMENTS
This release includes forward-looking statements within the meaning of Section 27A of the U.S. Securities Act of 1933, as amended, and Section 21E of the U.S. Securities Exchange Act of 1934, as amended. We base these forward-looking statements on our current beliefs, expectations and projections about future events and trends affecting our business and our market. Many important factors could cause our actual results to differ substantially from those anticipated in our forward-looking statements. Forward-looking statements are not guarantees of future performance. Forward-looking statements speak only as of the date they are made, and we undertake no obligation to update publicly or to revise any forward-looking statements. New risks and uncertainties emerge from time to time, and it is not possible for us to predict all risks and uncertainties that could have an impact on the forward-looking statements contained in this release. The words “believe,” “may,” “should,” “aim,” “estimate,” “continue,” “anticipate,” “intend,” “will,” “expect” and similar words are intended to identify forward-looking statements. Forward looking statements include information concerning our possible or assumed future results of operations, business strategies, capital expenditures, financing plans, competitive position, industry environment, potential growth opportunities, the effects of future regulation and the effects of competition. Please refer to our annual report on Form 20-F for the year ended December 31, 2024 filed with the U.S. Securities Exchange Commission (the “SEC”), as well as any subsequent filings made by us with the SEC, each of which is available on the SEC’s website (www.sec.gov), for a more extensive discussion of the risks and other factors that may impact any forward-looking statements in this release. Considering these limitations, you should not make any investment decision in reliance on forward-looking statements contained in this release.
ABOUT TIENDAS 3B
BBB Foods Inc. (“Tiendas 3B”), a proudly Mexican company, is a pioneer and leader of the grocery hard discount model in Mexico and one of the fastest growing retailers in the country as measured by its sales and store growth rates. The 3B name, which references "Bueno, Bonito y Barato" - a Mexican saying which translates to "Good, Nice and Affordable" - summarizes Tiendas 3B’s mission of offering irresistible value to budget savvy consumers through great quality products at bargain prices. By delivering value to the Mexican consumer, we believe we contribute to the economic well-being of Mexican families. In a landmark achievement, Tiendas 3B was listed on the New York Stock Exchange in February 2024 under the ticker symbol “TBBB”.
For more information, please visit: https://www.investorstiendas3b.com/
FINANCIAL STATEMENTS Consolidated Income Statement (Unaudited) |
|||
|
|||
For the three months ended December 31, 2025, and December 31, 2024 (In thousands of Mexican pesos) |
|||
|
|||
|
For the Three Months Ended December 31, |
||
|
2025 |
2024 |
% Change |
|
|
|
|
Revenue From Sales of Merchandise |
Ps. 21,944,649 |
Ps. 16,318,342 |
34.5% |
Sales of Recyclables |
27,835 |
28,276 |
(1.6%) |
Total Revenue |
21,972,484 |
16,346,618 |
34.4% |
Cost of Sales |
(18,392,193) |
(13,648,700) |
34.8% |
Gross Profit |
Ps. 3,580,291 |
Ps. 2,697,918 |
32.7% |
Gross Profit Margin |
16.3% |
16.5% |
|
Sales Expenses |
(2,316,900) |
(1,913,108) |
21.1% |
Administrative Expenses |
(1,549,175) |
(560,524) |
176.4% |
Other (Expense) Income - Net |
(200,161) |
53,978 |
n.m. |
Operating (Loss) Profit |
(Ps. 485,945) |
Ps. 278,264 |
n.m. |
Operating (Loss) Profit Margin |
(2.2%) |
1.7% |
|
Financial Income |
40,641 |
46,362 |
(12.3%) |
Financial Costs |
(447,332) |
(333,199) |
34.3% |
Exchange Rate Fluctuation |
(73,295) |
105,093 |
n.m. |
Financial Cost - Net |
(479,986) |
(181,744) |
164.1% |
Profit (Loss) Before Income Tax |
(Ps. 965,931) |
Ps. 96,520 |
n.m. |
Income Tax Expense |
(76,576) |
(120,091) |
(36.2%) |
Net Loss for the Period |
(Ps. 1,042,507) |
(Ps. 23,571) |
4322.8% |
Net Loss Margin |
(4.7%) |
(0.1%) |
|
|
|
|
|
Weighted average common shares |
116,045,917 |
112,200,752 |
|
Basic (loss) earnings per common share |
- |
- |
|
|
|
|
|
EBITDA Reconciliation |
|
|
|
Net Loss for the Period |
(Ps.1,042,507) |
(Ps.23,571) |
4322.8% |
Net Loss Margin |
(4.7%) |
(0.1%) |
|
Income Tax Expense |
(76,576) |
(120,091) |
(36.2%) |
Financial Cost - Net |
(479,986) |
(181,744) |
164.1% |
D&A |
565,387 |
566,513 |
(0.2%) |
EBITDA |
Ps. 79,442 |
Ps. 844,777 |
(90.6%) |
EBITDA margin |
0.4% |
5.2% |
|
Consolidated Income Statement (Unaudited) |
|||
For the year ended December 31, 2025, and December 31, 2024 (In thousands of Mexican pesos) |
|||
|
|||
|
For the Year Ended December 31, |
||
|
2025 |
2024 |
% Change |
|
|
|
|
Revenue From Sales of Merchandise |
Ps. 78,044,107 |
Ps. 57,333,327 |
36.1% |
Sales of Recyclables |
108,836 |
105,692 |
3.0% |
Total Revenue |
78,152,943 |
57,439,019 |
36.1% |
Cost of Sales |
(65,509,469) |
(48,062,913) |
36.3% |
Gross Profit |
Ps. 12,643,474 |
Ps. 9,376,106 |
34.8% |
Gross Profit Margin |
16.2% |
16.3% |
|
Sales Expenses |
(8,122,907) |
(6,121,566) |
32.7% |
Administrative Expenses |
(5,094,478) |
(1,987,075) |
156.4% |
Other (Expense) Income - Net |
(101,319) |
61,044 |
n.m. |
Operating (Loss) Profit |
(Ps. 675,230) |
Ps. 1,328,509 |
n.m. |
Operating (Loss) Profit Margin |
(0.9%) |
2.3% |
|
Financial Income |
172,674 |
155,863 |
10.8% |
Financial Costs |
(1,508,313) |
(1,257,254) |
20.0% |
Exchange Rate Fluctuation |
(384,951) |
490,428 |
n.m. |
Financial Cost - Net |
(1,720,590) |
(610,963) |
181.6% |
(Loss) Profit Before Income Tax |
(Ps. 2,395,820) |
Ps. 717,546 |
n.m. |
Income Tax Expense |
(443,751) |
(383,124) |
15.8% |
Net Profit (Loss) for the Period |
(Ps. 2,839,571) |
Ps. 334,422 |
n.m. |
Net Profit (Loss) Margin |
(3.6%) |
0.6% |
|
|
|
|
|
Weighted average common shares |
115,022,874 |
109,203,573 |
|
Basic (loss) earnings per common share |
- |
3.06 |
|
|
|
|
|
EBITDA Reconciliation |
|
|
|
Net Profit (Loss) for the Period |
(Ps.2,839,571) |
Ps. 334,422 |
n.m. |
Net Profit (Loss) Margin |
(3.6%) |
0.6% |
|
Income Tax Expense |
(443,751) |
(383,124) |
15.8% |
Financial Cost - Net |
(1,720,590) |
(610,963) |
181.6% |
D&A |
1,899,144 |
1,518,599 |
25.1% |
EBITDA |
Ps. 1,223,914 |
Ps. 2,847,108 |
(57.0%) |
EBITDA margin |
1.6% |
5.0% |
|
Consolidated Balance Sheet (Unaudited) |
||
As of December 31, 2025, and December 31, 2024 (In thousands of Mexican pesos) |
||
|
||
|
As of December 31, |
|
|
2025 |
2024 |
Current assets: |
|
|
Cash and cash equivalents |
Ps. 1,427,248 |
Ps. 1,447,166 |
Short-term bank deposits |
2,711,422 |
3,058,691 |
Sundry debtors - Net |
125,033 |
95,058 |
VAT and other taxes receivable |
1,172,101 |
843,926 |
Advanced payments |
72,927 |
70,925 |
Inventories |
4,217,417 |
3,038,373 |
Total Current Assets |
Ps. 9,726,148 |
Ps. 8,554,139 |
Non-Current Assets: |
|
|
Guarantee deposits |
109,096 |
72,652 |
VAT and other taxes receivable |
333,607 |
174,936 |
Property, furniture, equipment, and lease-hold improvements – Net |
9,348,874 |
6,455,625 |
Right-of-use assets – Net |
10,305,131 |
7,028,346 |
Intangible assets – Net |
27,819 |
6,790 |
Deferred income tax |
675,504 |
484,325 |
Total Non-Current Assets |
Ps. 20,800,031 |
Ps. 14,222,674 |
Total Assets |
Ps. 30,526,179 |
Ps. 22,776,813 |
|
|
|
Current liabilities: |
|
|
Suppliers |
Ps. 11,428,037 |
Ps. 8,835,875 |
Accounts payable and accrued expenses |
536,792 |
341,828 |
Income tax payable |
41,624 |
74,642 |
Bonus payable to related parties |
102,988 |
58,702 |
Short-term debt |
2,107,044 |
926,765 |
Lease liabilities |
1,118,382 |
750,127 |
Employees’ statutory profit sharing payable |
267,423 |
199,477 |
Total Current Liabilities |
Ps. 15,602,290 |
Ps. 11,187,416 |
Non-Current Liabilities: |
|
|
Long-term debt |
141,907 |
106,693 |
Lease liabilities |
10,612,062 |
7,415,363 |
Employee benefits |
44,487 |
32,559 |
Total Non-Current Liabilities |
Ps. 10,798,456 |
Ps. 7,554,615 |
Total Liabilities |
Ps. 26,400,746 |
Ps. 18,742,031 |
|
|
|
Stockholders’ equity: |
|
|
Capital stock |
9,325,356 |
8,283,347 |
Reserve for share-based payments |
3,263,057 |
1,374,844 |
Cumulative losses |
(8,462,980) |
(5,623,409) |
Total Stockholders’ Equity |
Ps. 4,125,433 |
Ps. 4,034,782 |
Total Liabilities and Stockholders’ Equity |
Ps. 30,526,179 |
Ps. 22,776,813 |
Cash Flow Statement (Unaudited) |
||
For the year ended December 31, 2025, and December 31, 2024 (In thousands of Mexican pesos) |
||
|
||
|
For the Twelve Months Ended December 31, |
|
|
2025 |
2024 |
|
|
|
(Loss) profit before income tax |
(Ps. 2,395,820) |
Ps. 717,547 |
Adjustments for: |
|
|
Depreciation of property, furniture, equipment, and lease-hold improvements |
868,830 |
719,987 |
Depreciation of right-of-use assets |
1,026,971 |
796,182 |
Amortization of intangible assets |
3,343 |
2,430 |
Employee benefits |
11,930 |
10,327 |
Interest payable on Promissory Notes and Convertible Notes |
- |
82,588 |
Interest expense on lease liabilities |
1,420,187 |
1,072,774 |
Interest on debt and bonus payable and amortization of issuance costs |
37,042 |
36,390 |
Other financial income |
(172,674) |
(155,863) |
Interests and commissions from credit lines |
51,084 |
65,503 |
Expected Credit Losses on Sundry Debtors |
230,151 |
- |
Loss on disposal of Property, furniture, equipment and lease-hold improvements |
18,937 |
- |
Loss on termination of lease agreements |
- |
1,573 |
Exchange rate fluctuation |
384,951 |
(490,428) |
Share-based payments expense |
2,930,222 |
523,143 |
|
|
|
Increase in inventories |
(1,179,045) |
(680,887) |
Increase in other current assets and guarantee deposits |
(785,418) |
(418,647) |
Increase in suppliers (including supplier finance arrangements) |
2,592,163 |
1,709,786 |
Increase in other current liabilities |
262,422 |
165,090 |
Increase (decrease) on bonus payable to related parties |
44,286 |
(20,648) |
Income taxes paid |
(667,949) |
(388,310) |
Net cash flows provided by operating activities |
Ps. 4,681,613 |
Ps. 3,748,537 |
|
|
|
Purchase of property, furniture, equipment, and lease-hold improvements |
(3,548,943) |
(2,435,695) |
Sale of property and equipment |
1,392 |
1,877 |
Additions to intangible assets |
(24,373) |
(2,449) |
Short-term bank deposits |
- |
(2,614,080) |
Interest received from settlement of derivative financial instruments |
- |
7,980 |
Interest earned on short-term investments |
163,042 |
135,071 |
Net cash flows used in investing activities |
(Ps. 3,408,882) |
(Ps. 4,907,296) |
|
|
|
Payments made on supplier finance arrangements-net of commissions received |
(5,831,149) |
(3,251,211) |
Finance obtained through supplier finance arrangements |
6,276,203 |
3,498,928 |
Proceeds from Santander and HSBC credit lines - Net |
723,836 |
- |
Payment of debt |
(176,250) |
(208,679) |
Interest payment on debt |
(88,126) |
(94,734) |
Principal payments on lease liabilities |
(738,802) |
(471,703) |
Interest payment on leases |
(1,420,187) |
(1,072,774) |
Payment of principal of Promissory Notes |
- |
(1,974,787) |
Payment of accrued Interests of Promissory Notes |
- |
(2,955,495) |
Proceeds from initial public offering, net of underwriting fees |
- |
7,841,837 |
Initial public offering costs |
- |
(23,269) |
Net cash flows obtained from (used in) financing activities |
(Ps. 1,254,475) |
Ps. 1,288,113 |
|
|
|
Net increase in cash and cash equivalents |
18,256 |
129,354 |
Effect of foreign exchange movements on cash balances |
(38,174) |
97,341 |
Cash and cash equivalents at beginning of period |
1,447,166 |
1,220,471 |
Cash and cash equivalents at end of period |
Ps. 1,427,248 |
Ps. 1,447,166 |
APPENDIX 1: FULLY DILUTED SHARES ILLUSTRATIVE CALCULATION
To further improve investor’s understanding of our capital structure, we are providing below an illustrative calculation of our fully diluted share count as of December 31, 2025, inclusive of Class A common shares and Class C common shares subject to vested and unvested stock options, restricted stock units, and Class C common shares under the Liquidity Event Share Plan and the Bolton Partners Share Allocation. We calculate our fully diluted common shares outstanding by assuming the “net settlement” of all our outstanding options at their weighted average strike price.
The illustrative example below assumes:
- Price per Class A common share: US$35.00
- Weighted average exercise price of US$5.74 per Class C common share subject to options granted under our Legacy 2004 Option Plan
- Weighted average exercise price of $32.90 per Class A common share subject to options granted under our 2024 Equity Incentive Plan
- All outstanding options are vested as of the date hereof, for illustrative purposes only
Illustrative Fully Diluted Share Count |
||
Share Count |
As of December 31, 2025 |
|
Class A common shares (publicly traded and registered) |
62,048,108 |
|
Class B common shares (high-vote shares) |
5,200,000 |
|
Class C common shares |
47,518,697 |
|
Common Shares Outstanding |
114,766,805 |
|
Liquidity Event Class C Shares (1) |
7,500,000 |
|
Bolton Partners Class C Share Allocation |
4,224,960 |
|
Class C Common Shares Subject to Vesting or Delayed Delivery |
11,724,960 |
|
Total Common Shares |
126,491,765 |
|
Net Shares subject to Equity-Based Compensation Plans(2) |
32,923,274 |
|
Fully Diluted Share Count |
159,415,039 |
|
(1) |
As of December 31, 2025, 1,875,000 of the Liquidity Event Class C Shares had been vested. |
|
(2) |
See the illustrative calculation below for how this figure is calculated. Assumes the net exercise at their weighted average strike price of all options granted under our legacy 2004 Option Plan, all options granted under our 2024 Equity Incentive Plan and all restricted stock units granted under our 2024 Equity Incentive Plan. |
|
Common Shares
|
|
Weighted-average
|
|
Net Shares(1) (2) |
Legacy 2004 Option Plan |
37,745,312 |
X |
(US$35.00 - US$5.74) |
= |
31,551,803 |
US$35.00 |
|||||
2024 Equity Incentive Plan Options |
4,090,000 |
X |
(US$35.00 - US$32.90) |
= |
245,471 |
US$35.00 |
|||||
2024 Equity Incentive Plan RSUs |
1,126,000 |
|
= |
|
1,126,000 |
Net Shares subject to Equity-Based Compensation Plans |
|
|
|
|
32,923,274 |
(1) |
|
Net share numbers have been rounded down to the nearest whole share. |
(2) |
For illustrative purposes we are assuming all options are exercised into Class A common shares but note that options under our Legacy 2004 Option Plan are exercisable for Class C common shares. All our Class C common shares are subject to a liquidity lock-up that expires on August 8, 2026 (subject to exceptions). |
The example above is provided for illustrative purposes only. The number of common shares outstanding would change if the strike price of the specific option being exercised were higher or lower than the weighted average strike price assumed for this exercise and/or if the market price for our Class A common shares was higher or lower at the time of exercise than the assumed price.
APPENDIX 2: SHARE-BASED PAYMENT EXPENSE
The tables and explanatory text below provide a breakdown of the expenses associated with stock options and restricted shares granted under the 2004 Option Plan, the 2024 Equity Incentive Plan, and the Liquidity Event Share Plan.
All our share-based compensation plans were previously fully disclosed in our offering documents and public filings, including in our annual report on Form 20-F for the year ended December 31, 2024 and for the year ended December 31, 2023 filed with the U.S. Securities Exchange Commission (the “SEC”), each of which is available on the SEC’s website (www.sec.gov) and on our investor relations website.
The previously disclosed Liquidity Event Share Plan in the aggregate amount of 7.5 million Class C common shares was subject to formal assignment and delivery. On June 24, 2025, Tiendas 3B formally granted the 7.5 million Class C common shares to the Liquidity Event Share Plan participants. Our board of directors also determined it was in the best interest of the Company primarily in relation to talent retention to subject the award to quarterly vesting over a three-year period. The corresponding expense will be recognized during such three-year period beginning in the third quarter of 2025 using a graded vesting model (accelerated expense recognition) with a corresponding increase to equity.
Under IFRS, the cost of this award is recognized as a non-cash expense in the profit and loss statement, even though the award is equity-settled. The fair value of the grant is determined at the grant date, and for awards with vesting conditions, the expense is recognized over the applicable vesting period. To improve investors’ understanding of how we recognize the non-cash expenses associated with each of our share-based payment arrangements, we are including below our current expectations for non-cash share-based payment expenses per program from 2025 until 2028. We note however, that these figures may vary slightly from initial estimates due to the actual vesting of the awards.
It is important to note that the formal grant of these awards and vesting schedule does not result in any additional dilution beyond what was previously disclosed and is already reflected in our fully diluted share count, discussed in Appendix 1. Additionally, the estimated share-based payment expense reflected in the table below only considers awards granted as of today. The Company may grant additional awards under the 2024 Equity Incentive Plan as administered by the Company’s compensation committee (or such other committee of our board of directors to which it has properly delegated power, or if no such committee or subcommittee exists, our board of directors).
Projected Share-Based Payment Non-Cash Expense(1) (In Ps. Million) |
||||||||
|
||||||||
Projected |
||||||||
Breakdown |
1Q26E |
2Q26E |
3Q26E |
4Q26E |
FY26E |
FY27E |
FY28E |
FY29E |
2004 Option Plan |
57 |
57 |
58 |
58 |
230 |
117 |
45 |
- |
2024 Equity Incentive Plan - Options |
131 |
133 |
134 |
134 |
532 |
278 |
143 |
50 |
2024 Equity Incentive Plan - RSUs |
62 |
63 |
63 |
63 |
252 |
17 |
- |
- |
Total |
250 |
253 |
255 |
255 |
1,013 |
412 |
188 |
50 |
Liquidity Event Shares |
472 |
373 |
298 |
235 |
1,378 |
470 |
28 |
- |
Total |
722 |
626 |
554 |
490 |
2,391 |
882 |
216 |
50 |
(1) |
|
Expense is recognized on a non-linear basis using a graded vesting method, being higher at the start of the period and decreasing over time. |
View source version on businesswire.com: https://www.businesswire.com/news/home/20260311242268/en/
Contacts
INVESTOR RELATIONS CONTACT
ir@tiendas3b.com


