
Programmatic advertising technology (AdTech) platform provider The Trade Desk Inc. (NYSE: TTD) saw its shares plunge 30% after reporting a strong Q3 2023 earnings report followed by soft Q4 2023 guidance. The company is the leading independent demand-side platform (DSP), which enables advertisers to buy digital ad inventory from multiple networks and ad exchanges through real-time bidding auctions. This is executed through a centralized platform to manage ad campaigns and measure data. The Trade Desk is in the Computer and Technology sector.
Digital advertising is rebounding.
The rebound in digital advertising has been echoed in earnings reports from various bellwether companies like Alphabet Inc. (NASDAQ: GOOGL) and Meta Platforms Inc. (NASDAQ: META), which saw ad impressions surge by 31% YoY. Google experienced 9.4% advertising growth and an 11.3% YoY surge in YouTube Ad revenues in its third quarter of 2023. Investors seeking a position in the leader in AdTech may consider the recent sell-off as a potential buying opportunity as the proverbial train has returned to the station.
What is programmatic advertising?
Programmatic advertising uses automation and algorithmic tools to buy and sell digital advertising using a data-driven approach to reach target audiences with precision and scale. This revolutionary method bypasses the legacy methods of manual ad buying, which involves negotiating prices and ad placements. It's more cost-effective, transparent and effective. Ad impressions get auctioned off in real-time, and advertisers seek to pay the optimal pricing for each impression.
Programmatic advertising utilizes mass amounts of data to target ads to be seen by the right people at the right time through cross-channel optimization that can include display, movable, video, connected TV (CTV) and social media. Programmatic TV (PTV) enables different ads to play to different people during the same streaming show or movie. It allows advertisers to deliver specific commercials to specifically matched viewers based on demographics, income, preferences and age to bolster its effectiveness and return on investment (ROI).
Strong Q3 2023 earnings
The Trade Desk reported its Q3 2023 EPS of 33 cents, beating consensus analyst estimates for 29 cents by four cents. Adjusted EBITDA grew 22.6% YoY to $199.5 million versus earlier guidance of $185 million. Revenues climbed 25% YoY to $493.27 million, beating analyst estimates of $486.91 million. Customer retention remained at over 95% for the 10th consecutive quarter.
The company continues collaborating and building support for Unified ID 2.0 (UID2), the industry-wide protocol for preserving relevant advertising while protecting user privacy. It has partnered with several networks and content providers like Comcast Inc. (NASDAQ: CMCSA), owned by NBC Universal and Warner Bros. Discovery Inc. (NYSE: WBD), and Walmart Inc. (NYSE: WMT) Connect. Check out the sector heatmap on MarketBeat.
Soft Q4 2023 Guidance
The Trade Desk reduced its Q4 2023 guidance to revenues of at least $580 million versus $610.4 million consensus analyst estimates. Adjusted EBITDA for Q4 2023 is expected to be around $270 million.
The Trade Desk CEO Jeff Green commented, "As we enter our busiest time of year and look ahead to 2024, we have never been in a better position to capture a greater share of the $1 trillion advertising TAM. With the generational shift to CTV, the growing opportunity in shopper marketing, our leadership in identity, and our most important product release ever with Kokai, we are better positioned than ever to help advertisers leverage data to drive growth and differentiate their brands."
The Trade Desk analyst ratings and price targets are at MarketBeat. The Trade Desk peers and competitor stocks can be found with the MarketBeat stock screener.
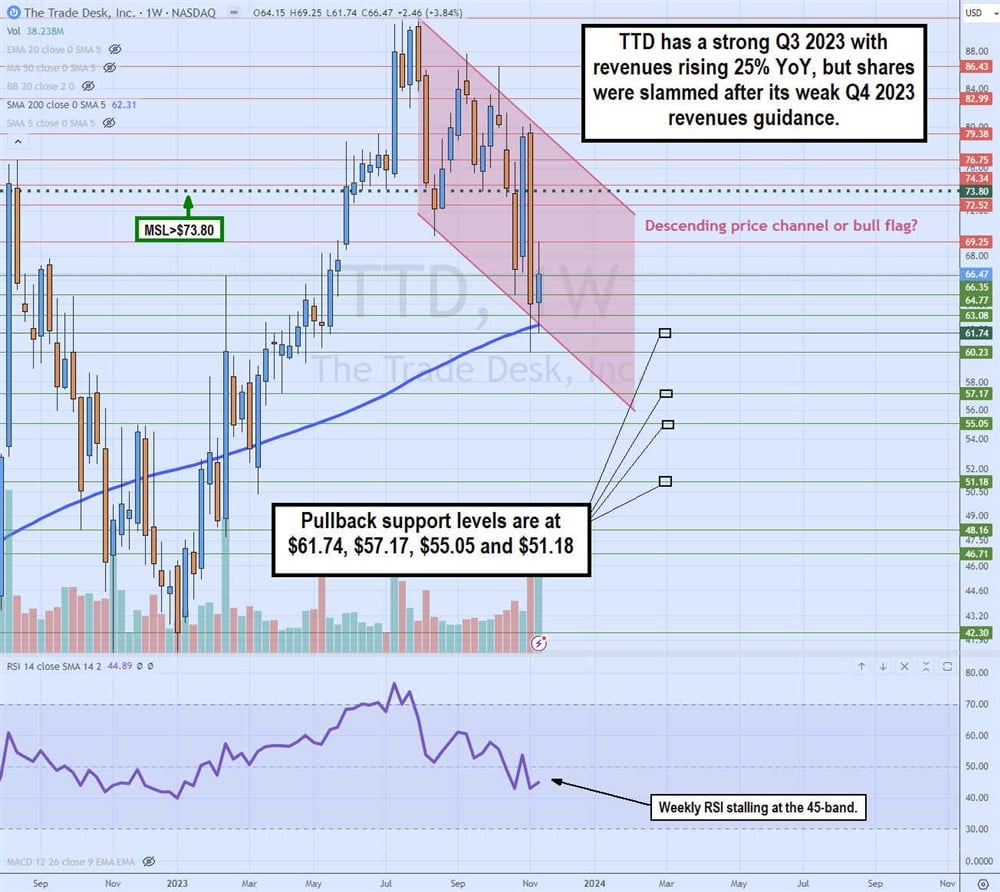
Weekly descending price channel or bull flag?
The weekly candlestick chart on TTD illustrates a descending price channel, which may turn into a bull flag if shares retrigger the weekly market structure low (MSL) breakout at $73.80. The upper descending trendline formed at $91.85 in July 2023 and has continued to fall in parallel with the lower descending trendline, indicating lower highs and lower lows. The 30% price drop on Q3 2023 earnings caused shares to fall below the weekly 200-period moving average and lower the trendline briefly until it coiled back into the range. The weekly relative strength index (RSI) attempts to bounce at the 45-band as shares hold above the 200-period moving average support. Pullback support levels are $61.74, $57.17, $55.05 and $51.18.


