Cosmetics beauty products retailer Ulta Beauty Inc. (NASDAQ: ULTA) shares fell (15%) on its Q1 2023 earnings results. While other retailers like Abercrombie & Fitch Co. (NYSE: ANF) and Urban Outfitters Inc. (NYSE: URBN) are seeing margin expansion, Ulta still deals with margin compression. Margin compression was still a factor as it experienced a (50 bps) drop in gross margins and a (70 bps) drop in operating margins in Q1 2023.
This was attributed to rising organized theft, labor, marketing and freight costs. Beauty, fragrance, cosmetics and skincare have been NASDAQ: ULTA">resilient industries throughout the pandemic, but inflation may be causing consumers to seek cheaper alternatives like e.l.f. Beauty Co.(NYSE: ELF) products. Ulta CFO Scott Settersten doesn't believe the promotional activity was the driver; instead, it was shrink. Shrink refers to the rising theft of inventory, damaged goods or inventory errors.
ULTA Robust Sales
On May 25, 2023, Ulta released its fiscal first-quarter 2023 results for the quarter ending April 2023. The company reported diluted earnings-per-share (EPS)of $6.88, beating consensus analyst estimates for a profit of $6.83 by $0.05. Net income was $347.1 million. Revenues rose 12.3% YOY to $2.63 billion, beating analyst estimates for $2.62 billion. Comparable sales rose 9.3%, compared to 18% in the year-ago period. Gross profits as a percentage of sales fell to 40% versus 40.1% in the year-ago period.
Gross Profit Growth for ULTA
Gross profit increased 12.1% to $1.1 billion compared to $941 million in Q1 2022 due to inventory shrinkage, higher supply chain costs, lower merchandise margins, and deleverage of salon expenses. The company closed out the quarter with $636.4 million in cash. Inventories grew to $1.75 billion to support higher product demand, cost increases and 41 net new stores.
Gross margins fell 50 bps to 34.9%, and operating margins fell (70 bps) to 14.4%. The company opened five new stores and remodeled two stores while closing one store and relocating one. Ulta operates 1,359 stores totaling 14.2 million square feet.
ULTA CEO Insights
Ulta Beauty CEO David Kimbell commented, “The year is off to a positive start as the Ulta Beauty team delivered revenue, operating margin, and diluted EPS consistent with our internal expectations. Store traffic remained healthy, member growth showed continued strength, we delivered growth across key categories, and we strengthened engagement with the Ulta Beauty brand.” He remains confident despite the operating environment “evolving” in the company’s ability to drive profit and share growth. He also believes margin compression should ease by the second half of 2023.
Updated 2023 Outlook for ULTA
Ulta reaffirmed most of its previous guidance for the fiscal full-year 2023. Comparable sales are still expected to grow between 4% to 5%. Net new stores are still expected between 25 to 30. Remodel and relocations are still expected between 20 to 30. However, the critical changes were the updated net sales high-end guidance shrink and (200 bps) decline in operating margin. Net sales were updated to $11 billion to $11.1 billion, from previous guidance of $10.95 billion to $11.05 billion. Analysts were expecting $11.09 billion. The operating margin was lowered from 14.5% to 14.8% from the previous expectation, between 14.7% to 15%.
Ulta analyst ratings and stock price targets are at MarketBeat.
The definitive beginner’s guide to reading stock charts can be found free on Marketbeat.
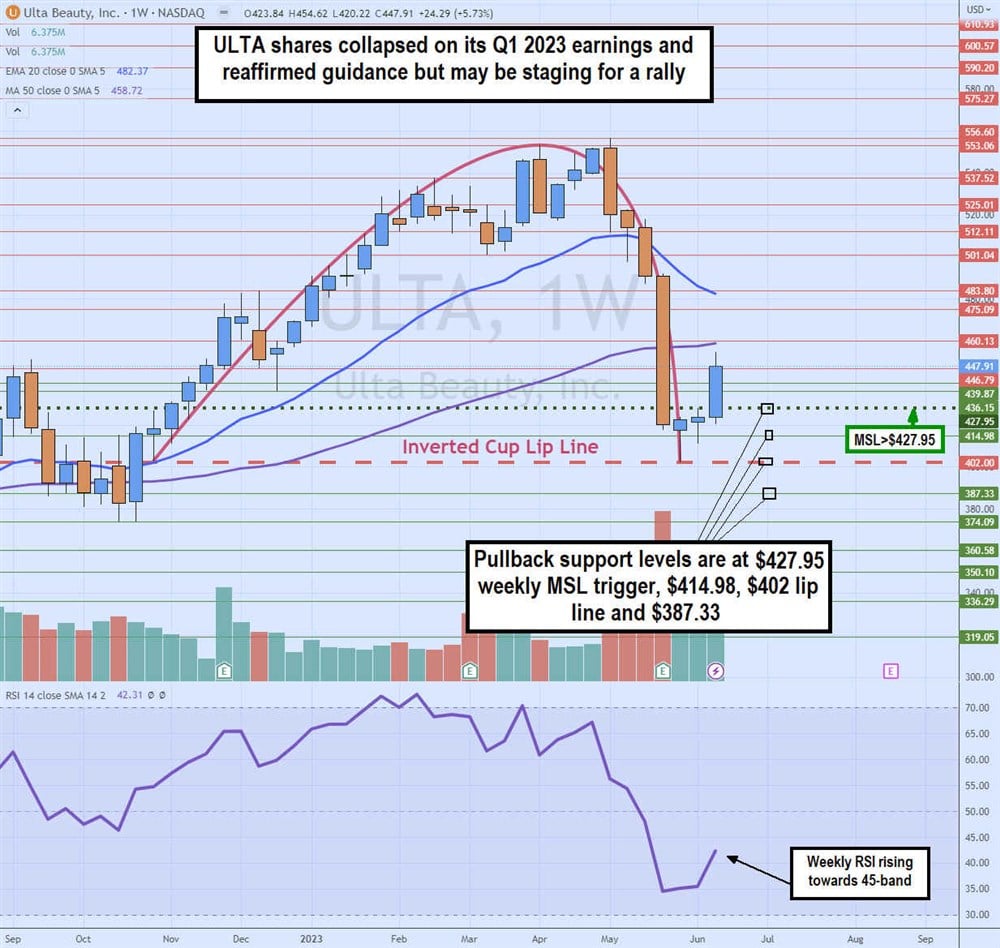
Weekly Inverted Cup
The weekly candlestick chart on ULTA may form an inverted cup and handle. The inverted cup lip line started to form at $402 in October 2022. Shares climbed to a high of $553.06 in April 2023 and a new high of $556.60 in May 2023, forming a rounding top as the weekly RSI was overbought at the 70-band. ULTA rug pulled for four straight weeks after making the new all-time high, hitting a low swing bottom at $402 at the weekly lip line.
The weekly market structure low (MSL) breakout through the $427.29 trigger has formed the inverse handle as the weekly RSI turns back off the 35-band. The weekly 50-period moving average (MA) resistance is $458.72, and the 20-period EMA sits at $482.37. Pullback support levels are $427.95 weekly MSL trigger, $414.98, $402 inverse cup lip line and $387.33.


