
Timeshare vacation company Hilton Grand Vacations (NYSE: HGV) fell short of the markets revenue expectations in Q3 CY2025, with sales flat year on year at $1.3 billion. Its non-GAAP profit of $0.60 per share was 38.5% below analysts’ consensus estimates.
Is now the time to buy Hilton Grand Vacations? Find out by accessing our full research report, it’s free for active Edge members.
Hilton Grand Vacations (HGV) Q3 CY2025 Highlights:
- Revenue: $1.3 billion vs analyst estimates of $1.37 billion (flat year on year, 5% miss)
- Adjusted EPS: $0.60 vs analyst expectations of $0.97 (38.5% miss)
- Adjusted EBITDA: $245 million vs analyst estimates of $299.1 million (18.8% margin, 18.1% miss)
- Operating Margin: -51.3%, down from 12.6% in the same quarter last year
- Free Cash Flow was -$4 million compared to -$42 million in the same quarter last year
- Members: 721,488, in line with the same quarter last year
- Market Capitalization: $3.89 billion
“We delivered broad-based operational and financial performance across key channels and geographies in the third quarter, reflecting the strength of our brand and our business model,” said Mark Wang, CEO of Hilton Grand Vacations.
Company Overview
Spun off from Hilton Worldwide in 2017, Hilton Grand Vacations (NYSE: HGV) is a global timeshare company that provides travel experiences for its customers through its timeshare resorts and club membership programs.
Revenue Growth
A company’s long-term performance is an indicator of its overall quality. Any business can put up a good quarter or two, but many enduring ones grow for years. Luckily, Hilton Grand Vacations’s sales grew at an incredible 32% compounded annual growth rate over the last five years. Its growth beat the average consumer discretionary company and shows its offerings resonate with customers.
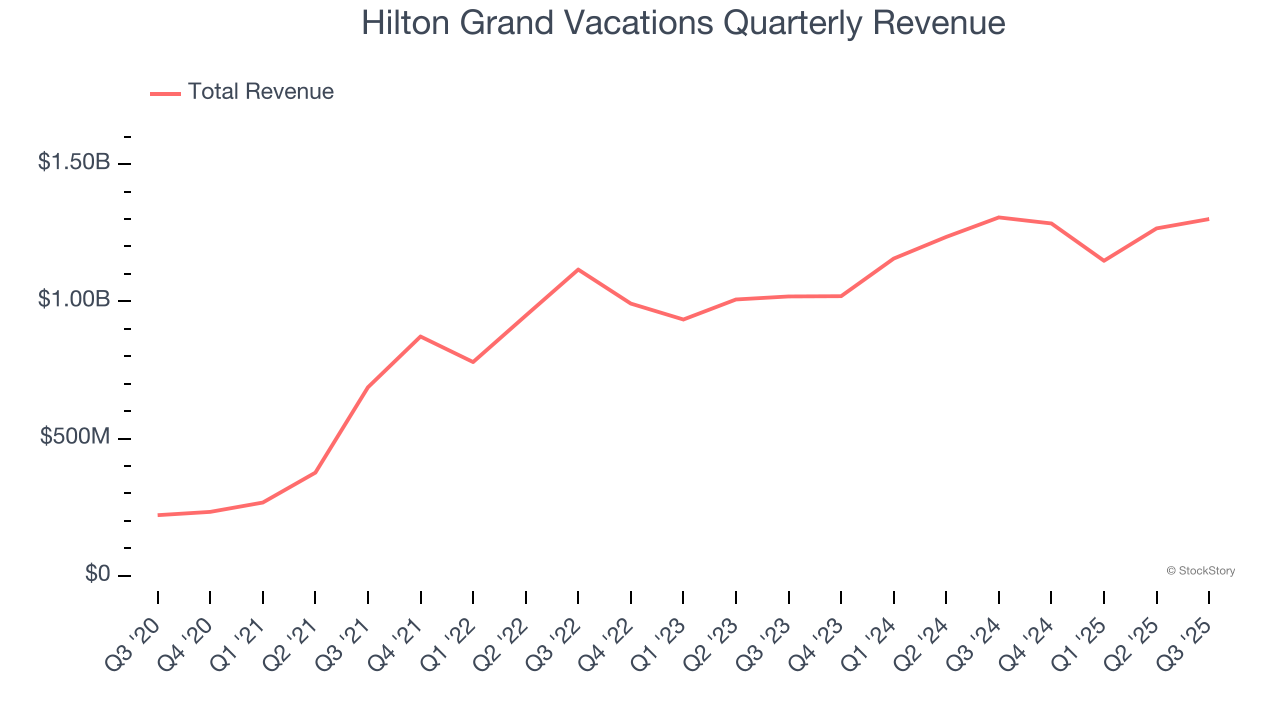
We at StockStory place the most emphasis on long-term growth, but within consumer discretionary, a stretched historical view may miss a company riding a successful new property or trend. Hilton Grand Vacations’s recent performance shows its demand has slowed significantly as its annualized revenue growth of 12.5% over the last two years was well below its five-year trend. 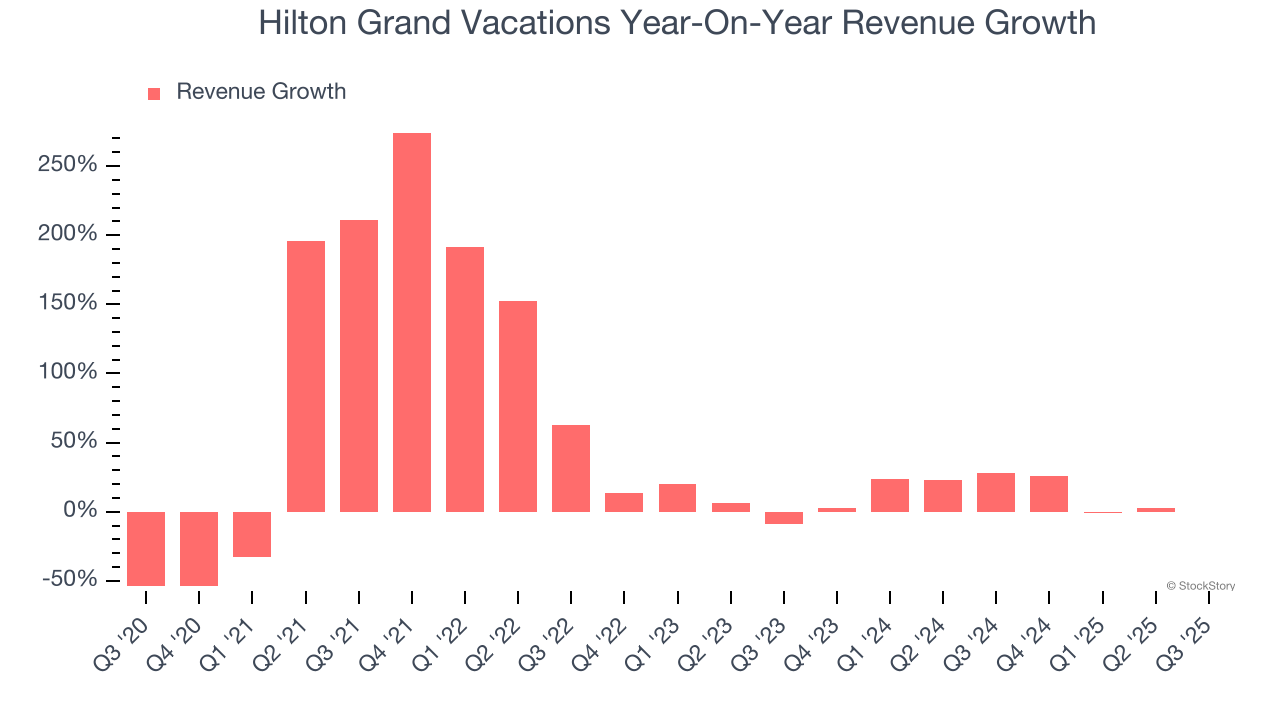
We can better understand the company’s revenue dynamics by analyzing its number of members and conducted tours, which clocked in at 721,488 and 232,035 in the latest quarter. Over the last two years, Hilton Grand Vacations’s members averaged 19.2% year-on-year growth while its conducted tours averaged 19.7% year-on-year growth. 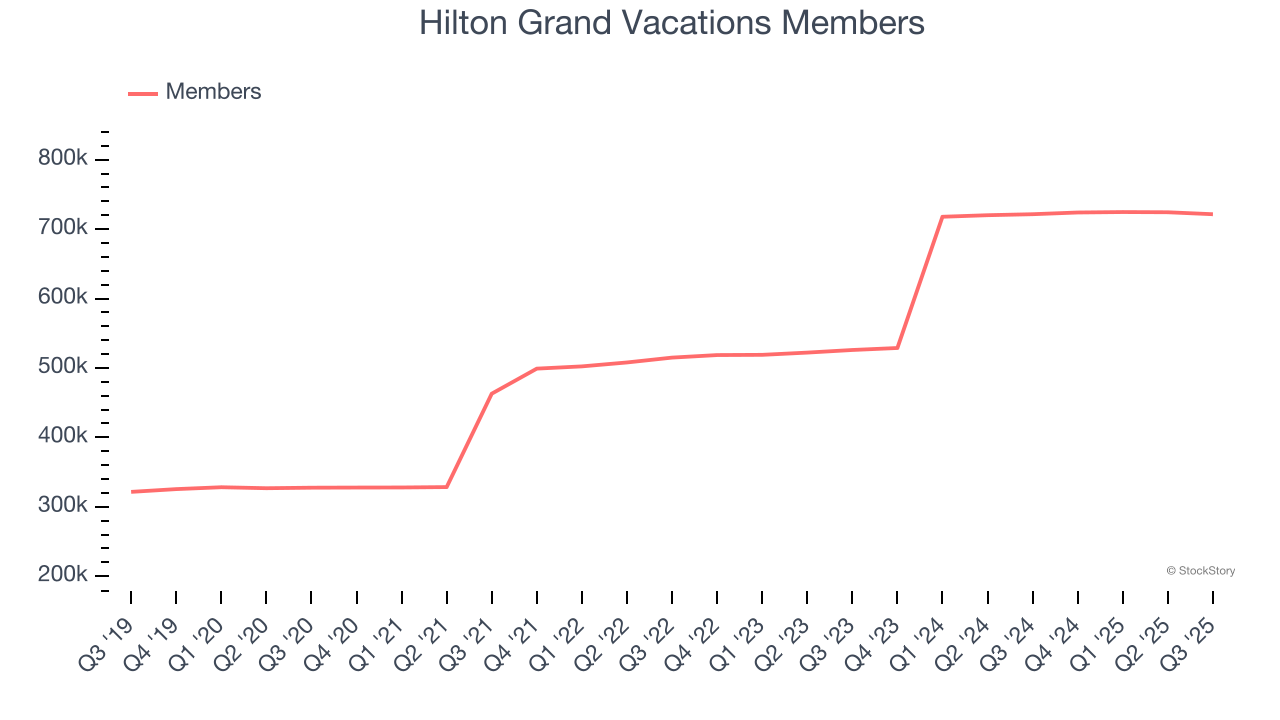
This quarter, Hilton Grand Vacations missed Wall Street’s estimates and reported a rather uninspiring 0.5% year-on-year revenue decline, generating $1.3 billion of revenue.
Looking ahead, sell-side analysts expect revenue to grow 11.1% over the next 12 months, similar to its two-year rate. This projection doesn't excite us and implies its products and services will face some demand challenges.
Today’s young investors won’t have read the timeless lessons in Gorilla Game: Picking Winners In High Technology because it was written more than 20 years ago when Microsoft and Apple were first establishing their supremacy. But if we apply the same principles, then enterprise software stocks leveraging their own generative AI capabilities may well be the Gorillas of the future. So, in that spirit, we are excited to present our Special Free Report on a profitable, fast-growing enterprise software stock that is already riding the automation wave and looking to catch the generative AI next.
Operating Margin
Hilton Grand Vacations’s operating margin has shrunk over the last 12 months and averaged 1.2% over the last two years. Although this result isn’t good, the company’s elite historical revenue growth suggests it ramped up investments to capture market share. We’ll keep a close eye to see if this strategy pays off.
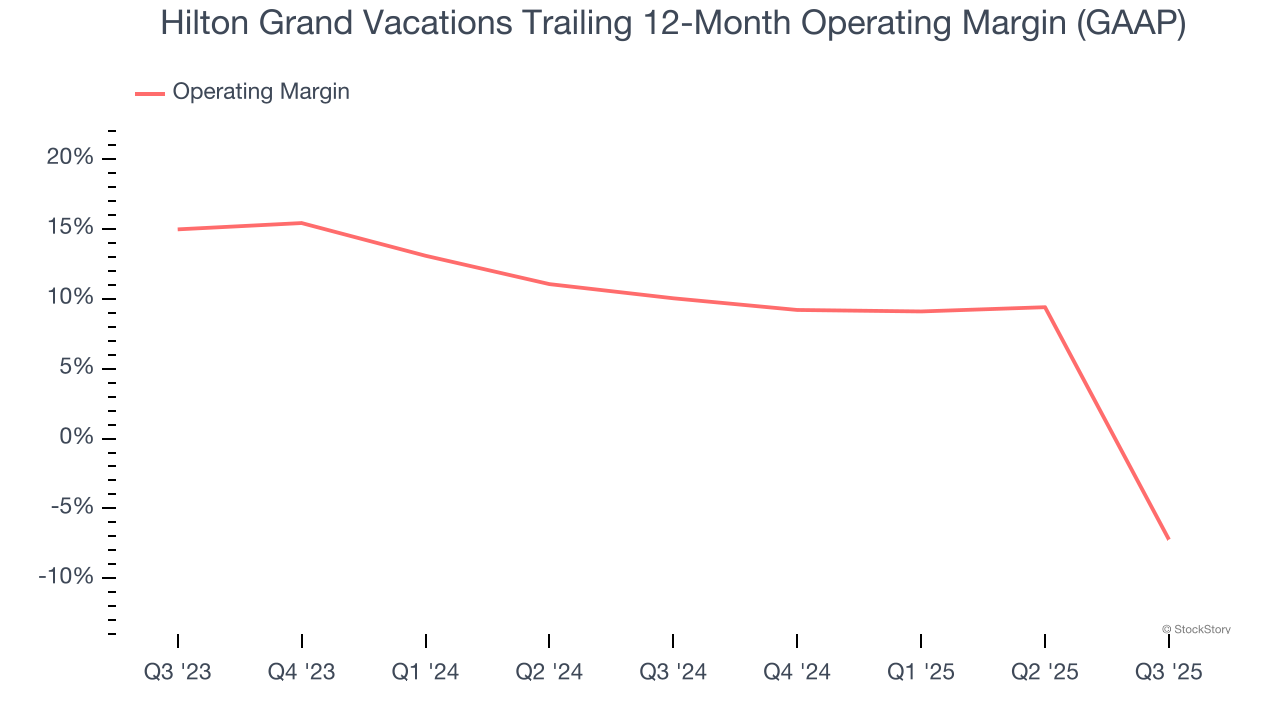
In Q3, Hilton Grand Vacations generated an operating margin profit margin of negative 51.3%, down 63.9 percentage points year on year. This contraction shows it was less efficient because its expenses increased relative to its revenue.
Earnings Per Share
We track the long-term change in earnings per share (EPS) for the same reason as long-term revenue growth. Compared to revenue, however, EPS highlights whether a company’s growth is profitable.
Hilton Grand Vacations’s EPS grew at an astounding 35.1% compounded annual growth rate over the last five years, higher than its 32% annualized revenue growth. However, we take this with a grain of salt because its operating margin didn’t improve and it didn’t repurchase its shares, meaning the delta came from reduced interest expenses or taxes.
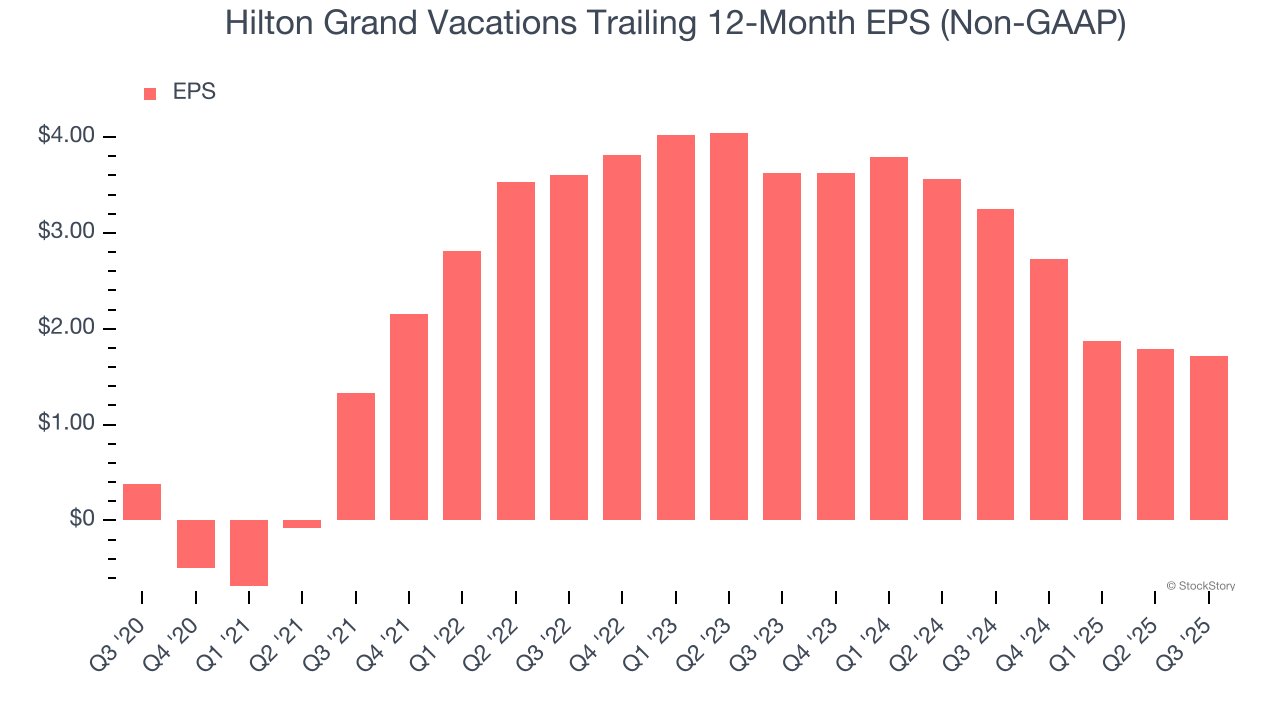
In Q3, Hilton Grand Vacations reported adjusted EPS of $0.60, down from $0.67 in the same quarter last year. This print missed analysts’ estimates, but we care more about long-term adjusted EPS growth than short-term movements. Over the next 12 months, Wall Street expects Hilton Grand Vacations’s full-year EPS of $1.72 to grow 119%.
Key Takeaways from Hilton Grand Vacations’s Q3 Results
We struggled to find many positives in these results. Its revenue missed and its EPS fell short of Wall Street’s estimates. Overall, this was a weaker quarter. The stock traded down 3.6% to $42.60 immediately following the results.
Hilton Grand Vacations’s latest earnings report disappointed. One quarter doesn’t define a company’s quality, so let’s explore whether the stock is a buy at the current price. What happened in the latest quarter matters, but not as much as longer-term business quality and valuation, when deciding whether to invest in this stock. We cover that in our actionable full research report which you can read here, it’s free for active Edge members.


