
Energy and industrial distributor DistributionNOW (NYSE: DNOW) met Wall Streets revenue expectations in Q3 CY2025, with sales up 4.6% year on year to $634 million. Its non-GAAP profit of $0.26 per share was 11.4% above analysts’ consensus estimates.
Is now the time to buy DistributionNOW? Find out by accessing our full research report, it’s free for active Edge members.
DistributionNOW (DNOW) Q3 CY2025 Highlights:
- Revenue: $634 million vs analyst estimates of $634.1 million (4.6% year-on-year growth, in line)
- Adjusted EPS: $0.26 vs analyst estimates of $0.23 (11.4% beat)
- Adjusted EBITDA: $51 million vs analyst estimates of $49.5 million (8% margin, 3% beat)
- Operating Margin: 5.2%, up from 3.8% in the same quarter last year
- Free Cash Flow Margin: 6.2%, down from 11.9% in the same quarter last year
- Market Capitalization: $1.56 billion
Company Overview
Spun off from National Oilwell Varco, DistributionNOW (NYSE: DNOW) provides distribution and supply chain solutions for the energy and industrial end markets.
Revenue Growth
Examining a company’s long-term performance can provide clues about its quality. Any business can put up a good quarter or two, but many enduring ones grow for years. Regrettably, DistributionNOW’s sales grew at a tepid 4.6% compounded annual growth rate over the last five years. This was below our standard for the industrials sector and is a rough starting point for our analysis.
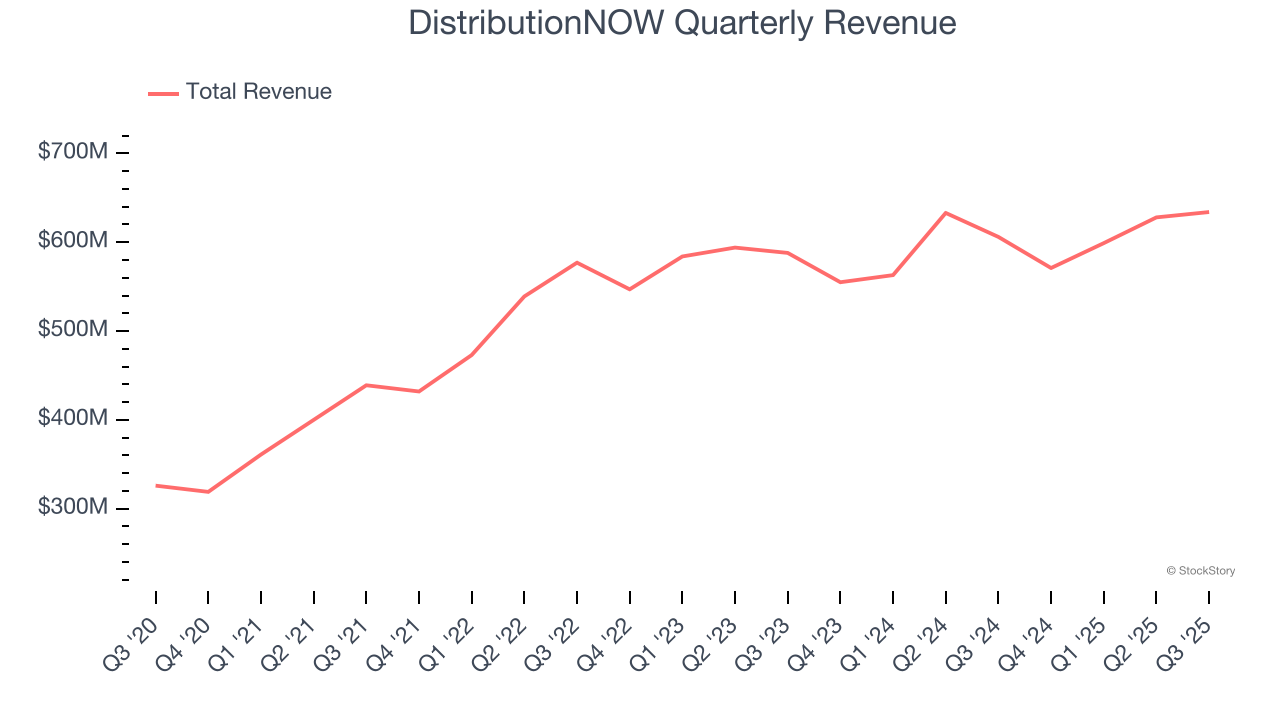
We at StockStory place the most emphasis on long-term growth, but within industrials, a half-decade historical view may miss cycles, industry trends, or a company capitalizing on catalysts such as a new contract win or a successful product line. DistributionNOW’s recent performance shows its demand has slowed as its annualized revenue growth of 2.5% over the last two years was below its five-year trend. 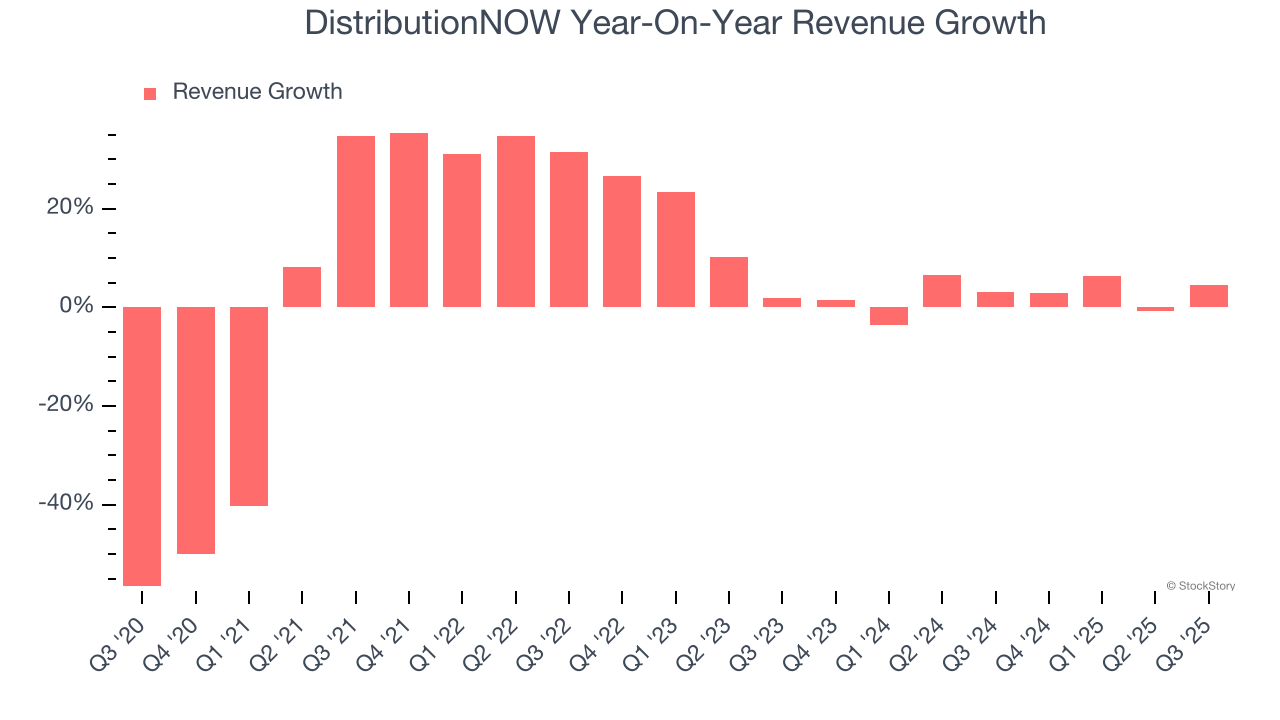
This quarter, DistributionNOW grew its revenue by 4.6% year on year, and its $634 million of revenue was in line with Wall Street’s estimates.
Looking ahead, sell-side analysts expect revenue to grow 3.6% over the next 12 months, similar to its two-year rate. Although this projection suggests its newer products and services will fuel better top-line performance, it is still below average for the sector.
While Wall Street chases Nvidia at all-time highs, an under-the-radar semiconductor supplier is dominating a critical AI component these giants can’t build without. Click here to access our free report one of our favorites growth stories.
Operating Margin
Operating margin is one of the best measures of profitability because it tells us how much money a company takes home after procuring and manufacturing its products, marketing and selling those products, and most importantly, keeping them relevant through research and development.
DistributionNOW was profitable over the last five years but held back by its large cost base. Its average operating margin of 4.2% was weak for an industrials business. This result isn’t too surprising given its low gross margin as a starting point.
On the plus side, DistributionNOW’s operating margin rose by 7.4 percentage points over the last five years, as its sales growth gave it operating leverage.
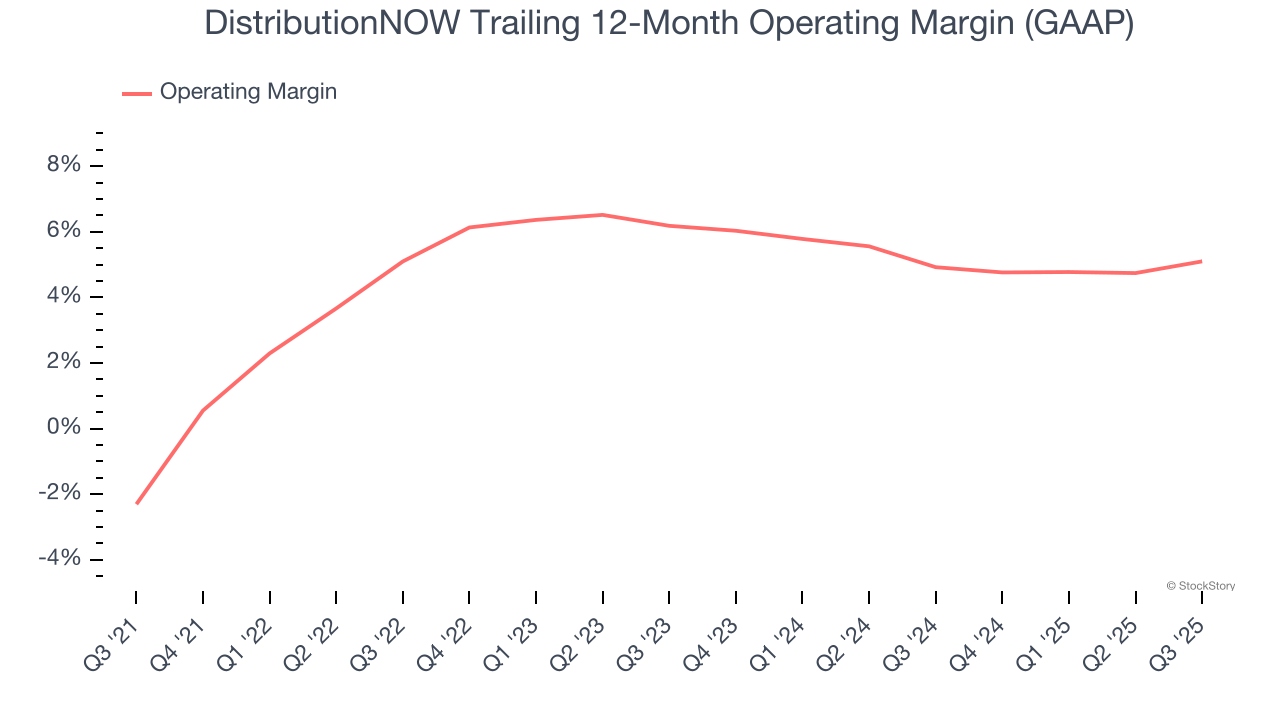
In Q3, DistributionNOW generated an operating margin profit margin of 5.2%, up 1.4 percentage points year on year. The increase was encouraging, and because its operating margin rose more than its gross margin, we can infer it was more efficient with expenses such as marketing, R&D, and administrative overhead.
Earnings Per Share
Revenue trends explain a company’s historical growth, but the long-term change in earnings per share (EPS) points to the profitability of that growth – for example, a company could inflate its sales through excessive spending on advertising and promotions.
DistributionNOW’s full-year EPS flipped from negative to positive over the last five years. This is encouraging and shows it’s at a critical moment in its life.
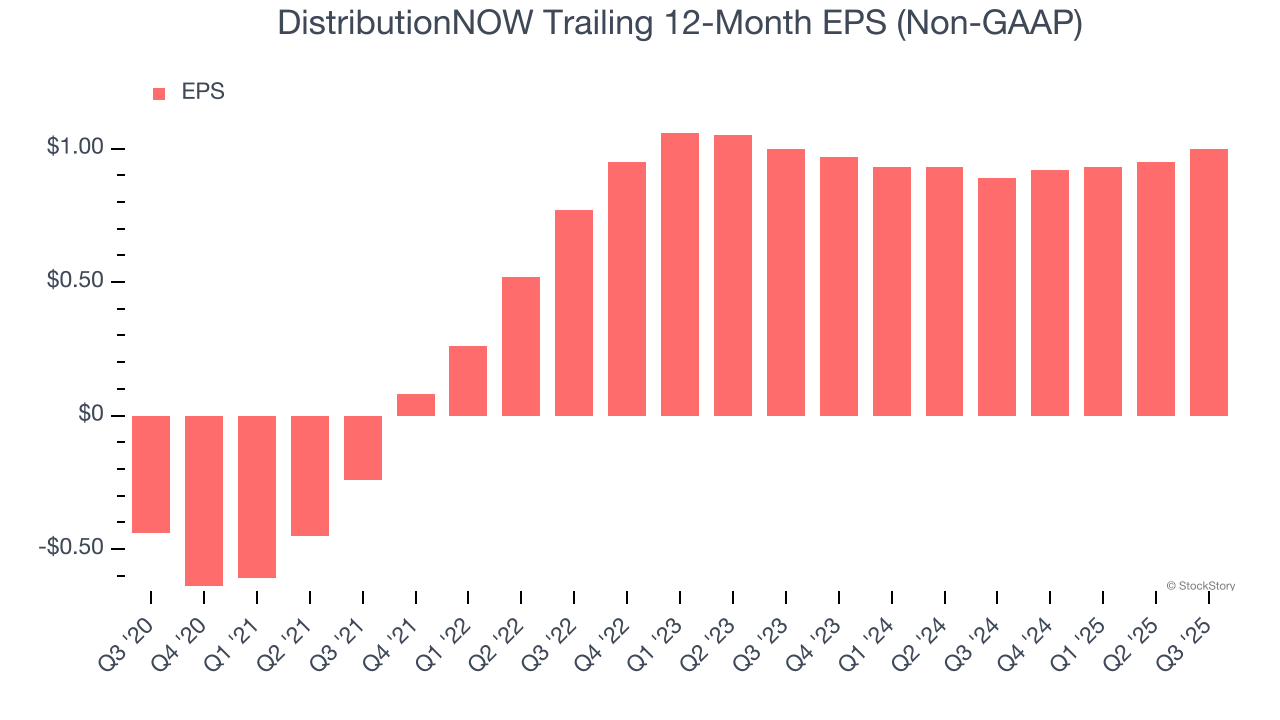
Like with revenue, we analyze EPS over a more recent period because it can provide insight into an emerging theme or development for the business.
DistributionNOW’s flat EPS over the last two years was worse than its 2.5% annualized revenue growth. This tells us the company became less profitable on a per-share basis as it expanded.
We can take a deeper look into DistributionNOW’s earnings to better understand the drivers of its performance. While we mentioned earlier that DistributionNOW’s operating margin expanded this quarter, a two-year view shows its margin has declined. This was the most relevant factor (aside from the revenue impact) behind its lower earnings; interest expenses and taxes can also affect EPS but don’t tell us as much about a company’s fundamentals.
In Q3, DistributionNOW reported adjusted EPS of $0.26, up from $0.21 in the same quarter last year. This print easily cleared analysts’ estimates, and shareholders should be content with the results. We also like to analyze expected EPS growth based on Wall Street analysts’ consensus projections, but there is insufficient data.
Key Takeaways from DistributionNOW’s Q3 Results
It was good to see DistributionNOW beat analysts’ EPS expectations this quarter. We were also happy its EBITDA outperformed Wall Street’s estimates. Overall, this print had some key positives. The market seemed to be hoping for more, and the stock traded down 4.9% to $13.90 immediately following the results.
Is DistributionNOW an attractive investment opportunity right now? When making that decision, it’s important to consider its valuation, business qualities, as well as what has happened in the latest quarter. We cover that in our actionable full research report which you can read here, it’s free for active Edge members.


