
Fashion conglomerate Oxford Industries (NYSE: OXM) fell short of the market’s revenue expectations in Q2 CY2025, with sales falling 4% year on year to $403.1 million. Next quarter’s revenue guidance of $302.5 million underwhelmed, coming in 2.1% below analysts’ estimates. Its non-GAAP profit of $1.26 per share was 6.8% above analysts’ consensus estimates.
Is now the time to buy Oxford Industries? Find out by accessing our full research report, it’s free.
Oxford Industries (OXM) Q2 CY2025 Highlights:
- Revenue: $403.1 million vs analyst estimates of $406.1 million (4% year-on-year decline, 0.7% miss)
- Adjusted EPS: $1.26 vs analyst estimates of $1.18 (6.8% beat)
- The company reconfirmed its revenue guidance for the full year of $1.50 billion at the midpoint
- Management reiterated its full-year Adjusted EPS guidance of $3 at the midpoint
- Operating Margin: 6.3%, down from 12.5% in the same quarter last year
- Free Cash Flow Margin: 13%, up from 11.2% in the same quarter last year
- Market Capitalization: $608.6 million
Tom Chubb, Chairman and CEO, commented, “Our teams executed well in a dynamic trade and tariff environment, delivering sales within our guidance range and an adjusted EPS above our guidance range for the second quarter driven by better-than-expected gross margins. We have moved quickly to diversify our sourcing as well as to pull some inventory receipts forward and calibrate pricing with care to help partially offset the impact on product costs from the incremental tariffs and evolving trade environment that has emerged this year. The results of our efforts allowed us to continue to offer the product assortment our customer expects from our brands while maintaining our strong margin profile."
Company Overview
The parent company of Tommy Bahama, Oxford Industries (NYSE: OXM) is a lifestyle fashion conglomerate with brands that embody outdoor happiness.
Revenue Growth
A company’s long-term sales performance can indicate its overall quality. Any business can experience short-term success, but top-performing ones enjoy sustained growth for years. Over the last five years, Oxford Industries grew its sales at a 10.9% compounded annual growth rate. Although this growth is acceptable on an absolute basis, it fell short of our standards for the consumer discretionary sector, which enjoys a number of secular tailwinds.
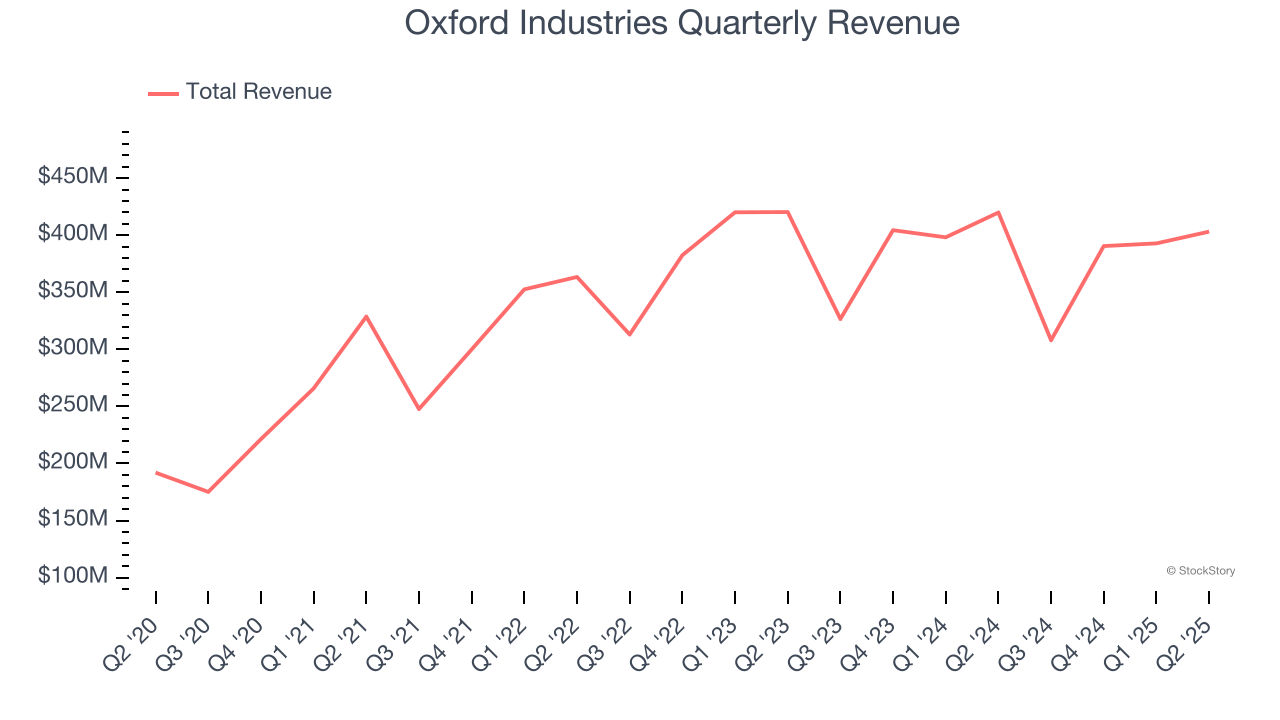
We at StockStory place the most emphasis on long-term growth, but within consumer discretionary, a stretched historical view may miss a company riding a successful new product or trend. Oxford Industries’s performance shows it grew in the past but relinquished its gains over the last two years, as its revenue fell by 1.4% annually. 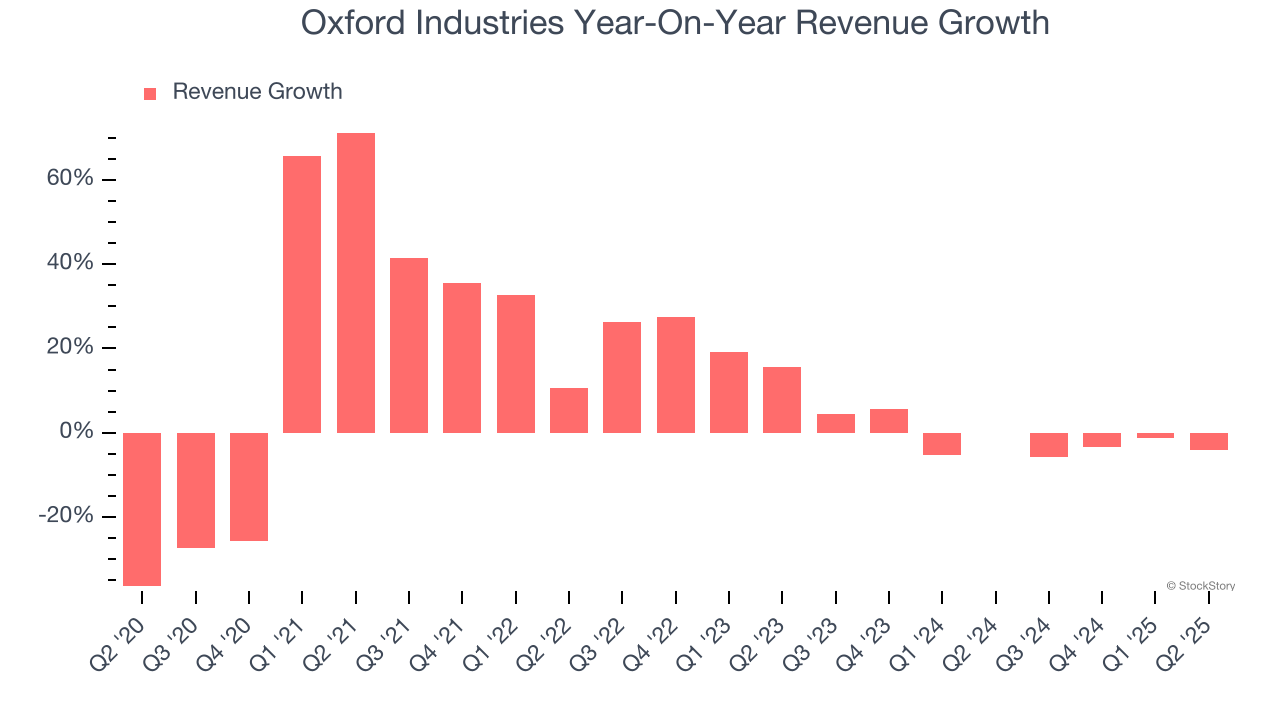
This quarter, Oxford Industries missed Wall Street’s estimates and reported a rather uninspiring 4% year-on-year revenue decline, generating $403.1 million of revenue. Company management is currently guiding for a 1.8% year-on-year decline in sales next quarter.
Looking further ahead, sell-side analysts expect revenue to grow 1.8% over the next 12 months. While this projection indicates its newer products and services will spur better top-line performance, it is still below average for the sector.
Today’s young investors won’t have read the timeless lessons in Gorilla Game: Picking Winners In High Technology because it was written more than 20 years ago when Microsoft and Apple were first establishing their supremacy. But if we apply the same principles, then enterprise software stocks leveraging their own generative AI capabilities may well be the Gorillas of the future. So, in that spirit, we are excited to present our Special Free Report on a profitable, fast-growing enterprise software stock that is already riding the automation wave and looking to catch the generative AI next.
Operating Margin
Oxford Industries’s operating margin has been trending up over the last 12 months and averaged 3.7% over the last two years. The company’s higher efficiency is a breath of fresh air, but its suboptimal cost structure means it still sports lousy profitability for a consumer discretionary business.
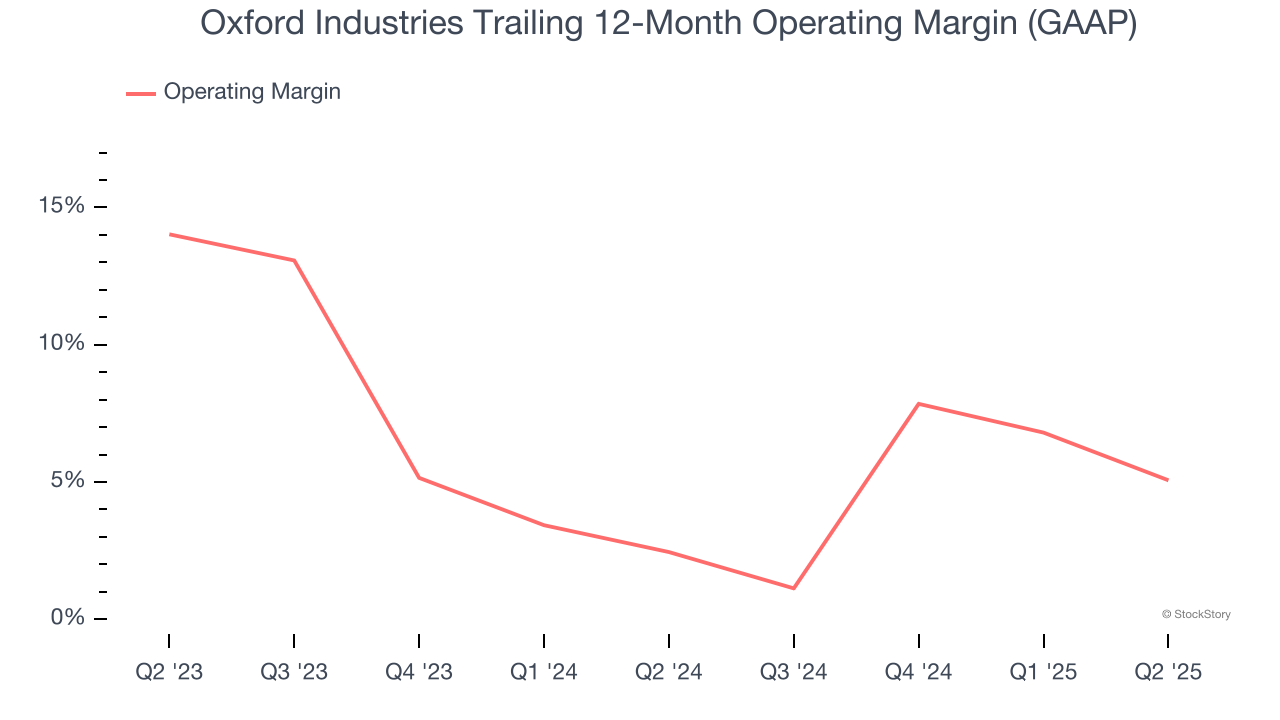
This quarter, Oxford Industries generated an operating margin profit margin of 6.3%, down 6.2 percentage points year on year. This contraction shows it was less efficient because its expenses increased relative to its revenue.
Earnings Per Share
We track the long-term change in earnings per share (EPS) for the same reason as long-term revenue growth. Compared to revenue, however, EPS highlights whether a company’s growth is profitable.
Oxford Industries’s full-year EPS flipped from negative to positive over the last five years. This is encouraging and shows it’s at a critical moment in its life.
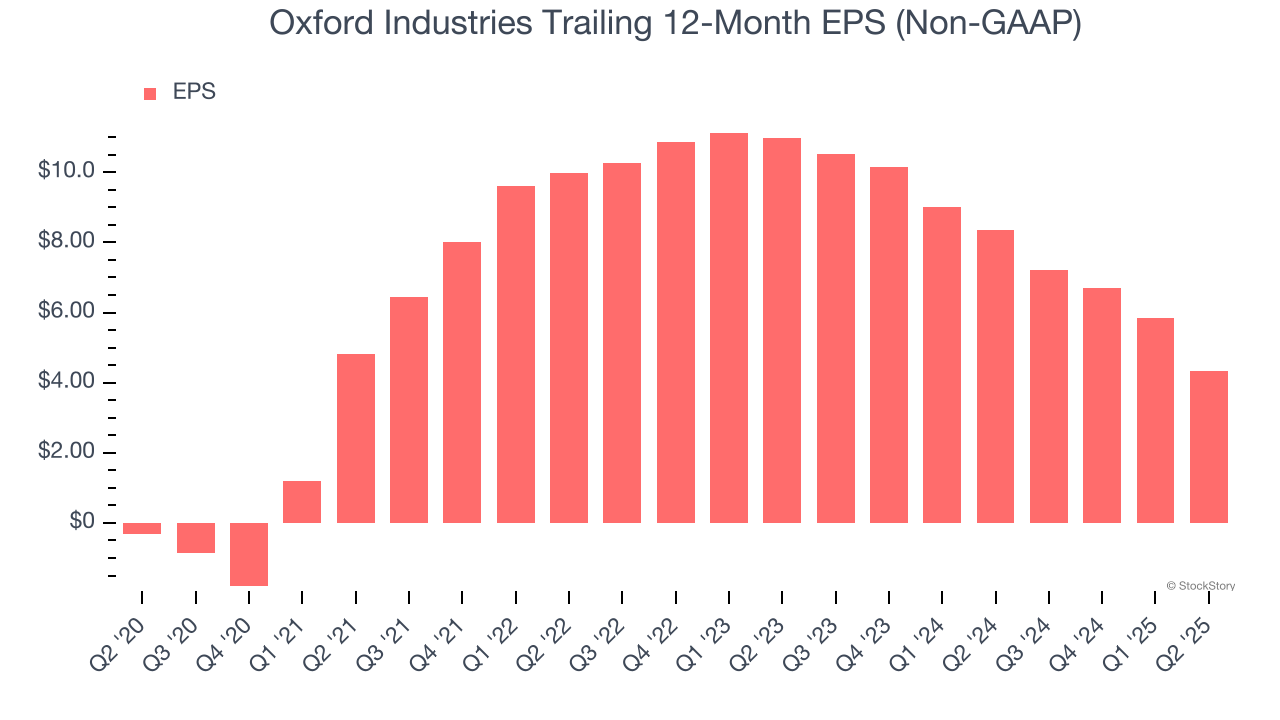
In Q2, Oxford Industries reported adjusted EPS of $1.26, down from $2.77 in the same quarter last year. Despite falling year on year, this print beat analysts’ estimates by 6.8%. Over the next 12 months, Wall Street expects Oxford Industries’s full-year EPS of $4.34 to shrink by 19.7%.
Key Takeaways from Oxford Industries’s Q2 Results
It was great to see Oxford Industries’s EPS top analysts’ expectations. We were also glad its full-year EPS guidance, which was reaffirmed, outperformed Wall Street’s estimates as well. On the other hand, the company's revenue missed and its revenue guidance for next quarter fell short of Wall Street’s estimates. It seems like the market is willing to overlook topline weakness due to bottom-line strength. The stock traded up 12.3% to $45.40 immediately after reporting.
So do we think Oxford Industries is an attractive buy at the current price? The latest quarter does matter, but not nearly as much as longer-term fundamentals and valuation, when deciding if the stock is a buy. We cover that in our actionable full research report which you can read here, it’s free.


