
Jack in the Box trades at $23.54 and has moved in lockstep with the market. Its shares have returned 13.8% over the last six months while the S&P 500 has gained 10.6%.
Is there a buying opportunity in Jack in the Box, or does it present a risk to your portfolio? Get the full breakdown from our expert analysts, it’s free.
Why Do We Think Jack in the Box Will Underperform?
We don't have much confidence in Jack in the Box. Here are three reasons there are better opportunities than JACK and a stock we'd rather own.
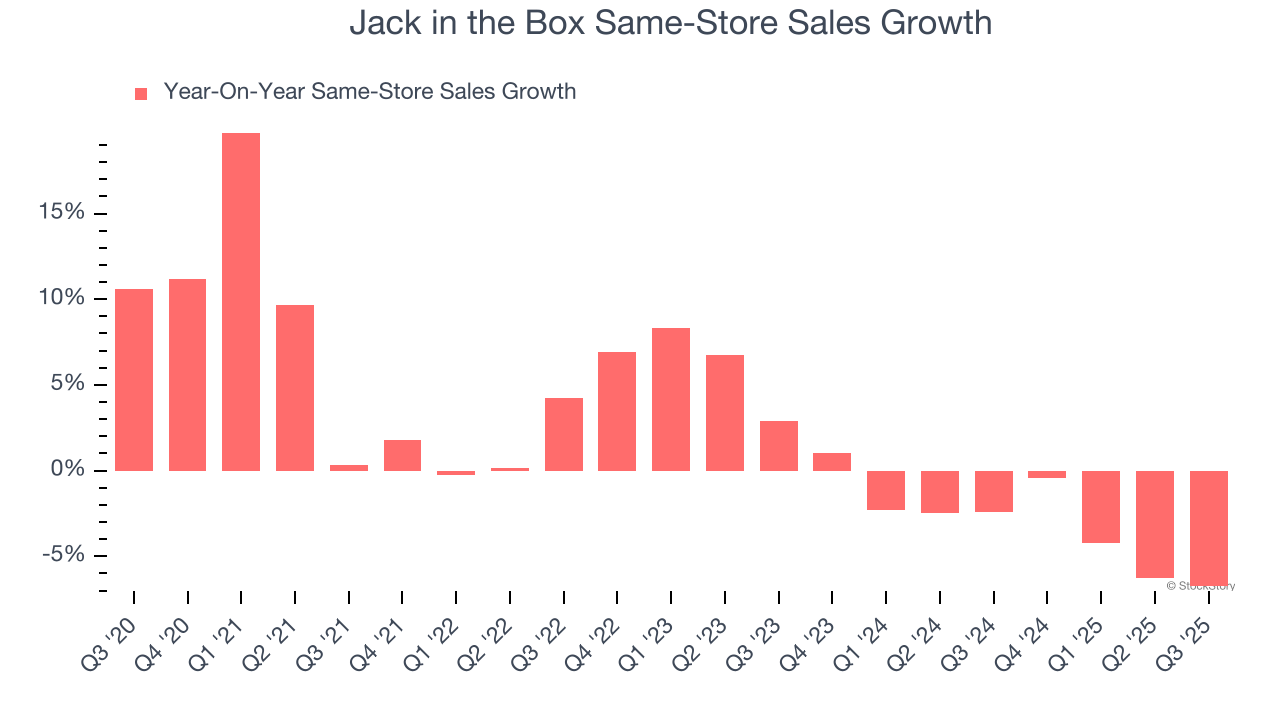
1. Shrinking Same-Store Sales Indicate Waning Demand
Same-store sales is an industry measure of whether revenue is growing at existing restaurants, and it is driven by customer visits (often called traffic) and the average spending per customer (ticket).
Jack in the Box’s demand has been shrinking over the last two years as its same-store sales have averaged 3% annual declines.
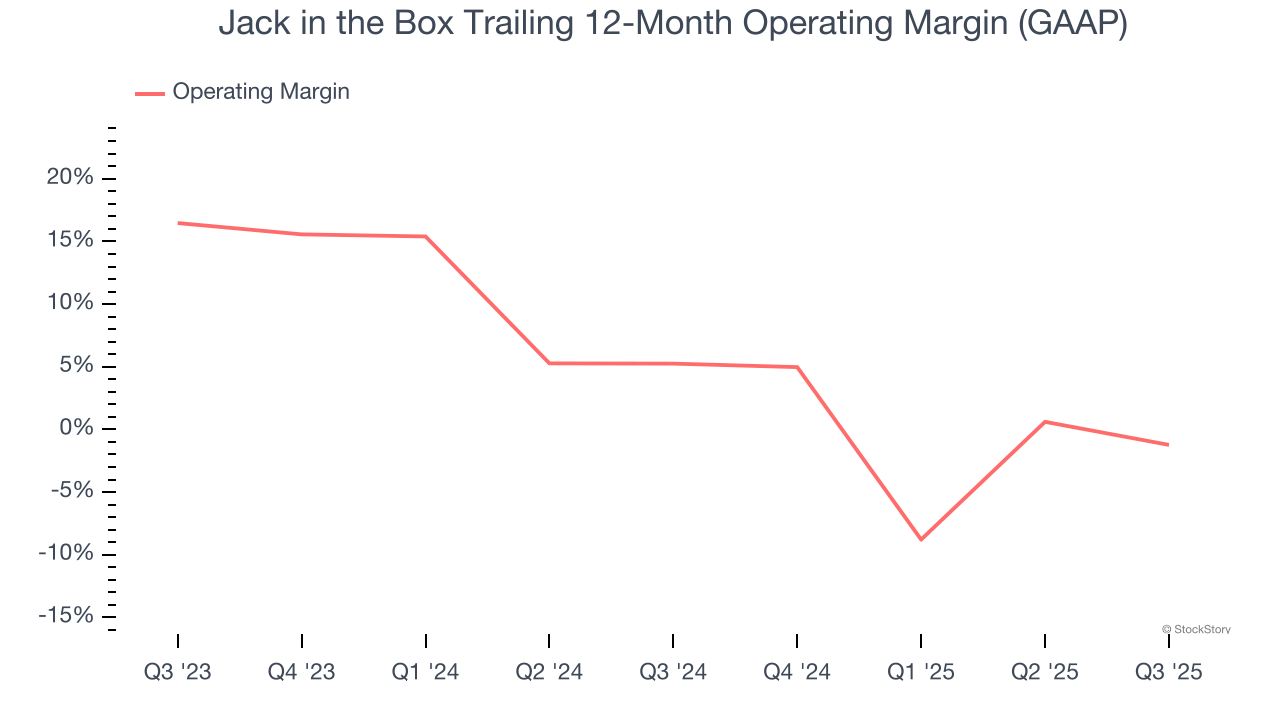
2. Shrinking Operating Margin
Operating margin is an important measure of profitability as it shows the portion of revenue left after accounting for all core expenses – everything from the cost of goods sold to advertising and wages. It’s also useful for comparing profitability across companies with different levels of debt and tax rates because it excludes interest and taxes.
Looking at the trend in its profitability, Jack in the Box’s operating margin decreased by 6.5 percentage points over the last year. This raises questions about the company’s expense base because its revenue growth should have given it leverage on its fixed costs, resulting in better economies of scale and profitability. Jack in the Box’s performance was poor no matter how you look at it - it shows that costs were rising and it couldn’t pass them onto its customers. Its operating margin for the trailing 12 months was negative 1.2%.
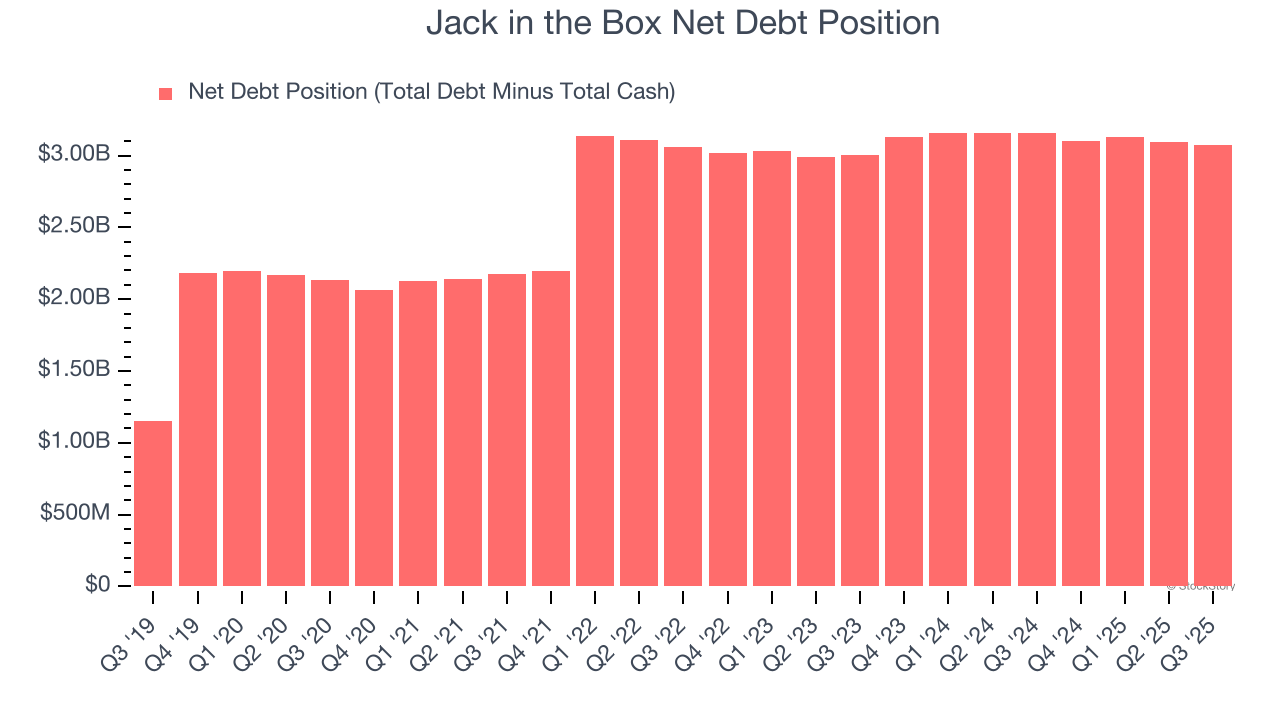
3. High Debt Levels Increase Risk
Debt is a tool that can boost company returns but presents risks if used irresponsibly. As long-term investors, we aim to avoid companies taking excessive advantage of this instrument because it could lead to insolvency.
Jack in the Box’s $3.12 billion of debt exceeds the $51.53 million of cash on its balance sheet. Furthermore, its 11× net-debt-to-EBITDA ratio (based on its EBITDA of $270.9 million over the last 12 months) shows the company is overleveraged.
At this level of debt, incremental borrowing becomes increasingly expensive and credit agencies could downgrade the company’s rating if profitability falls. Jack in the Box could also be backed into a corner if the market turns unexpectedly – a situation we seek to avoid as investors in high-quality companies.
We hope Jack in the Box can improve its balance sheet and remain cautious until it increases its profitability or pays down its debt.
Final Judgment
Jack in the Box doesn’t pass our quality test. That said, the stock currently trades at 5.7× forward P/E (or $23.54 per share). While this valuation is optically cheap, the potential downside is huge given its shaky fundamentals. There are better stocks to buy right now. Let us point you toward our favorite semiconductor picks and shovels play.
High-Quality Stocks for All Market Conditions
Your portfolio can’t afford to be based on yesterday’s story. The risk in a handful of heavily crowded stocks is rising daily.
The names generating the next wave of massive growth are right here in our Top 5 Strong Momentum Stocks for this week. This is a curated list of our High Quality stocks that have generated a market-beating return of 244% over the last five years (as of June 30, 2025).
Stocks that have made our list include now familiar names such as Nvidia (+1,326% between June 2020 and June 2025) as well as under-the-radar businesses like the once-small-cap company Exlservice (+354% five-year return). Find your next big winner with StockStory today.


