Industrial metal exploration company Freeport-McMoRan Inc. (FCX) has emerged as a tech-savvy mining operator. The company’s leadership recognized the importance of Artificial Intelligence (AI) and Machine Learning (ML) in growing its mining productivity.
The company executed an “Americas’ Concentrator” program to unlock additional annual copper production through the use of big data and agile working methods. This could unlock a 125,000 metric tons per day production increase, representing $350 million to $500 million in EBITDA.
Last month, FCX declared cash dividends of $0.15 per share, payable to shareholders on November 1. This includes a base dividend of $0.075 per share and a variable dividend of $0.075 per share, aligning with the company’s performance-based payout framework. Its annual dividend of $0.30 yields 0.84% on prevailing prices.
Given this backdrop, let’s look at the trends of FCX’s key financial metrics to understand why it could be wise to buy the stock before the company reports its third-quarter financials on October 19.
Analyzing Freeport-McMoRan's Performance: Fluctuating Trends Across Key Financial Metrics
The analysis of the Price/Earnings ratio (P/E) for FCX reveals a marked downtrend with noticeable fluctuations:
- On December 31, 2020, the P/E ratio stood notably high at 80.11.
- In the first quarter of the subsequent year, a significant plunge by more than half brought the P/E ratio to 33.67 by March 31, 2021.
- The falling trend continued in the second quarter, halving the ratio further to 18.54 by the end of June 2021.
- Minor dips were observed through the final two quarters of 2021, taking the P/E ratio to 13.91 on September 30 and slightly up to 14.75 by December 31 of the same year.
- The P/E ratio continued its descent in the first half of 2022, hitting a low of 8.88 by June 30.
- An upward swing took place in the latter half of 2022, with the ratio climbing back to 17.45 by December 31, marking almost twice the value since the mid-year low.
- The rising trend extended into 2023, where the P/E ratio hit 19.38 by March 31 and rose significantly to reach 29.29 as of June 30.
It is observed that while the overall trend is downward from the beginning of 2020 till mid-2022, there are distinct fluctuations, particularly noticeable in the latter half of 2022 and the first half of 2023, which see a sustained rise.
When measuring the growth rate from the first shown value to the latest, we observe a decrease of approximately 63.44%. However, the recent data and the last value show a promising upward trend, indicating potential growth in the company's performance.

The trailing-12-month revenue trend for FCX reveals an upward trajectory and periodic fluctuations over the past three years, as seen in the provided data series. Summary:
- December 2020: Revenue started at approximately $14.2 billion.
- March 2023: The series concludes with a revenue of approximately $21.9 billion, roughly a 54% increase from the initial value.
- There was significant growth in revenue from 2021 into 2022, peaking at around $24.6 billion in March 2022. This was followed by a slight dip in mid-2022 and then a further decline toward early 2023.
- The largest recorded single-period drop occurred between December 2022 ($22.8 billion) and March 2023 ($21.7 billion).
Yearly Observations:
- 2021: In this year, FCX experienced substantial growth, moving from $14.2 billion in December 2020 to closing the year in December 2021 with a revenue of about $22.8 billion.
- 2022: The revenue peaked mid-year at $24.6 billion in March but then reduced slightly for the remaining months, ending the year at about $22.8 billion in December.
- 2023: Revenue declined gradually till March, where it rested at $21.9 billion. Even though this is lower than the previous highs of 2022, it still maintains healthy growth when observed from the start of the series.
Overall, while the general trend was upward, FCX's revenue reflects cyclic fluctuations, demonstrating periodic accelerations and decelerations within the broader growing trend.

The current ratio of FCX has shown both upward and downward fluctuations over the period from December 2020 to June 2023.
- On December 31, 2020, the current ratio was at 2.72.
- The trend showed a slight decrease in the first half of 2021, with a drop to 2.28 by June 2021.
- However, the second half of the year reflected a slight increase, reaching 2.52 by the end of December 2021.
- A brief drop in the current ratio was observed in the first quarter of 2022 to 2.37, but it rose again to 2.73 by the end of June 2022.
- A fluctuating downward trend was then witnessed through the rest of 2022, with the current ratio dropping to 2.46 by the end of December 2022.
- This was followed by another rise in the first half of 2023, resulting in the value ascending to 2.94 by June of that year.
Overall, between December 2020 and June 2023, the current ratio of FCX increased by approximately 7.8%, demonstrating a relatively stable performance with minor fluctuations.
Emphasizing the most recent data, the current ratio for June 2023 was at a high of 2.94, indicating a higher ability of the company relative to previous quarters to pay its short-term obligations. This might suggest a stronger financial stability position for the company.

Here's a summarized analysis of the asset turnover trend and fluctuations for FCX:
FCX experienced an upward trend in its asset turnover from December 2020 to March 2022. During this period, the figure grew from 0.35 to 0.52, indicating an increase in the company's efficiency in utilizing its assets. This suggests improved operational efficiency over this time span.
After March 2022, the asset turnover started declining, falling to 0.43 by June 2023. This development signals a relative decrease in the efficiency with which FCX used its assets during this period.
The data fluctuates throughout the given period, but the general trend indicates increased efficiency until March 2022, followed by a downturn until June 2023. Below are key observations:
- December 31, 2020: asset turnover at 0.35
- March 31, 2022: Reached peak asset turnover at 0.52 (Growth rate of approximately 48.57% from December 2020)
- June 30, 2023: Asset turnover down to 0.43 (Decline rate of about 17.31% from the peak in March 2022)
The overall growth rate from the first value in December 2020 to the last recorded value in June 2023 is approximately 23.43%. It's worth noting that greater emphasis is placed on more recent data, particularly the last value recorded.

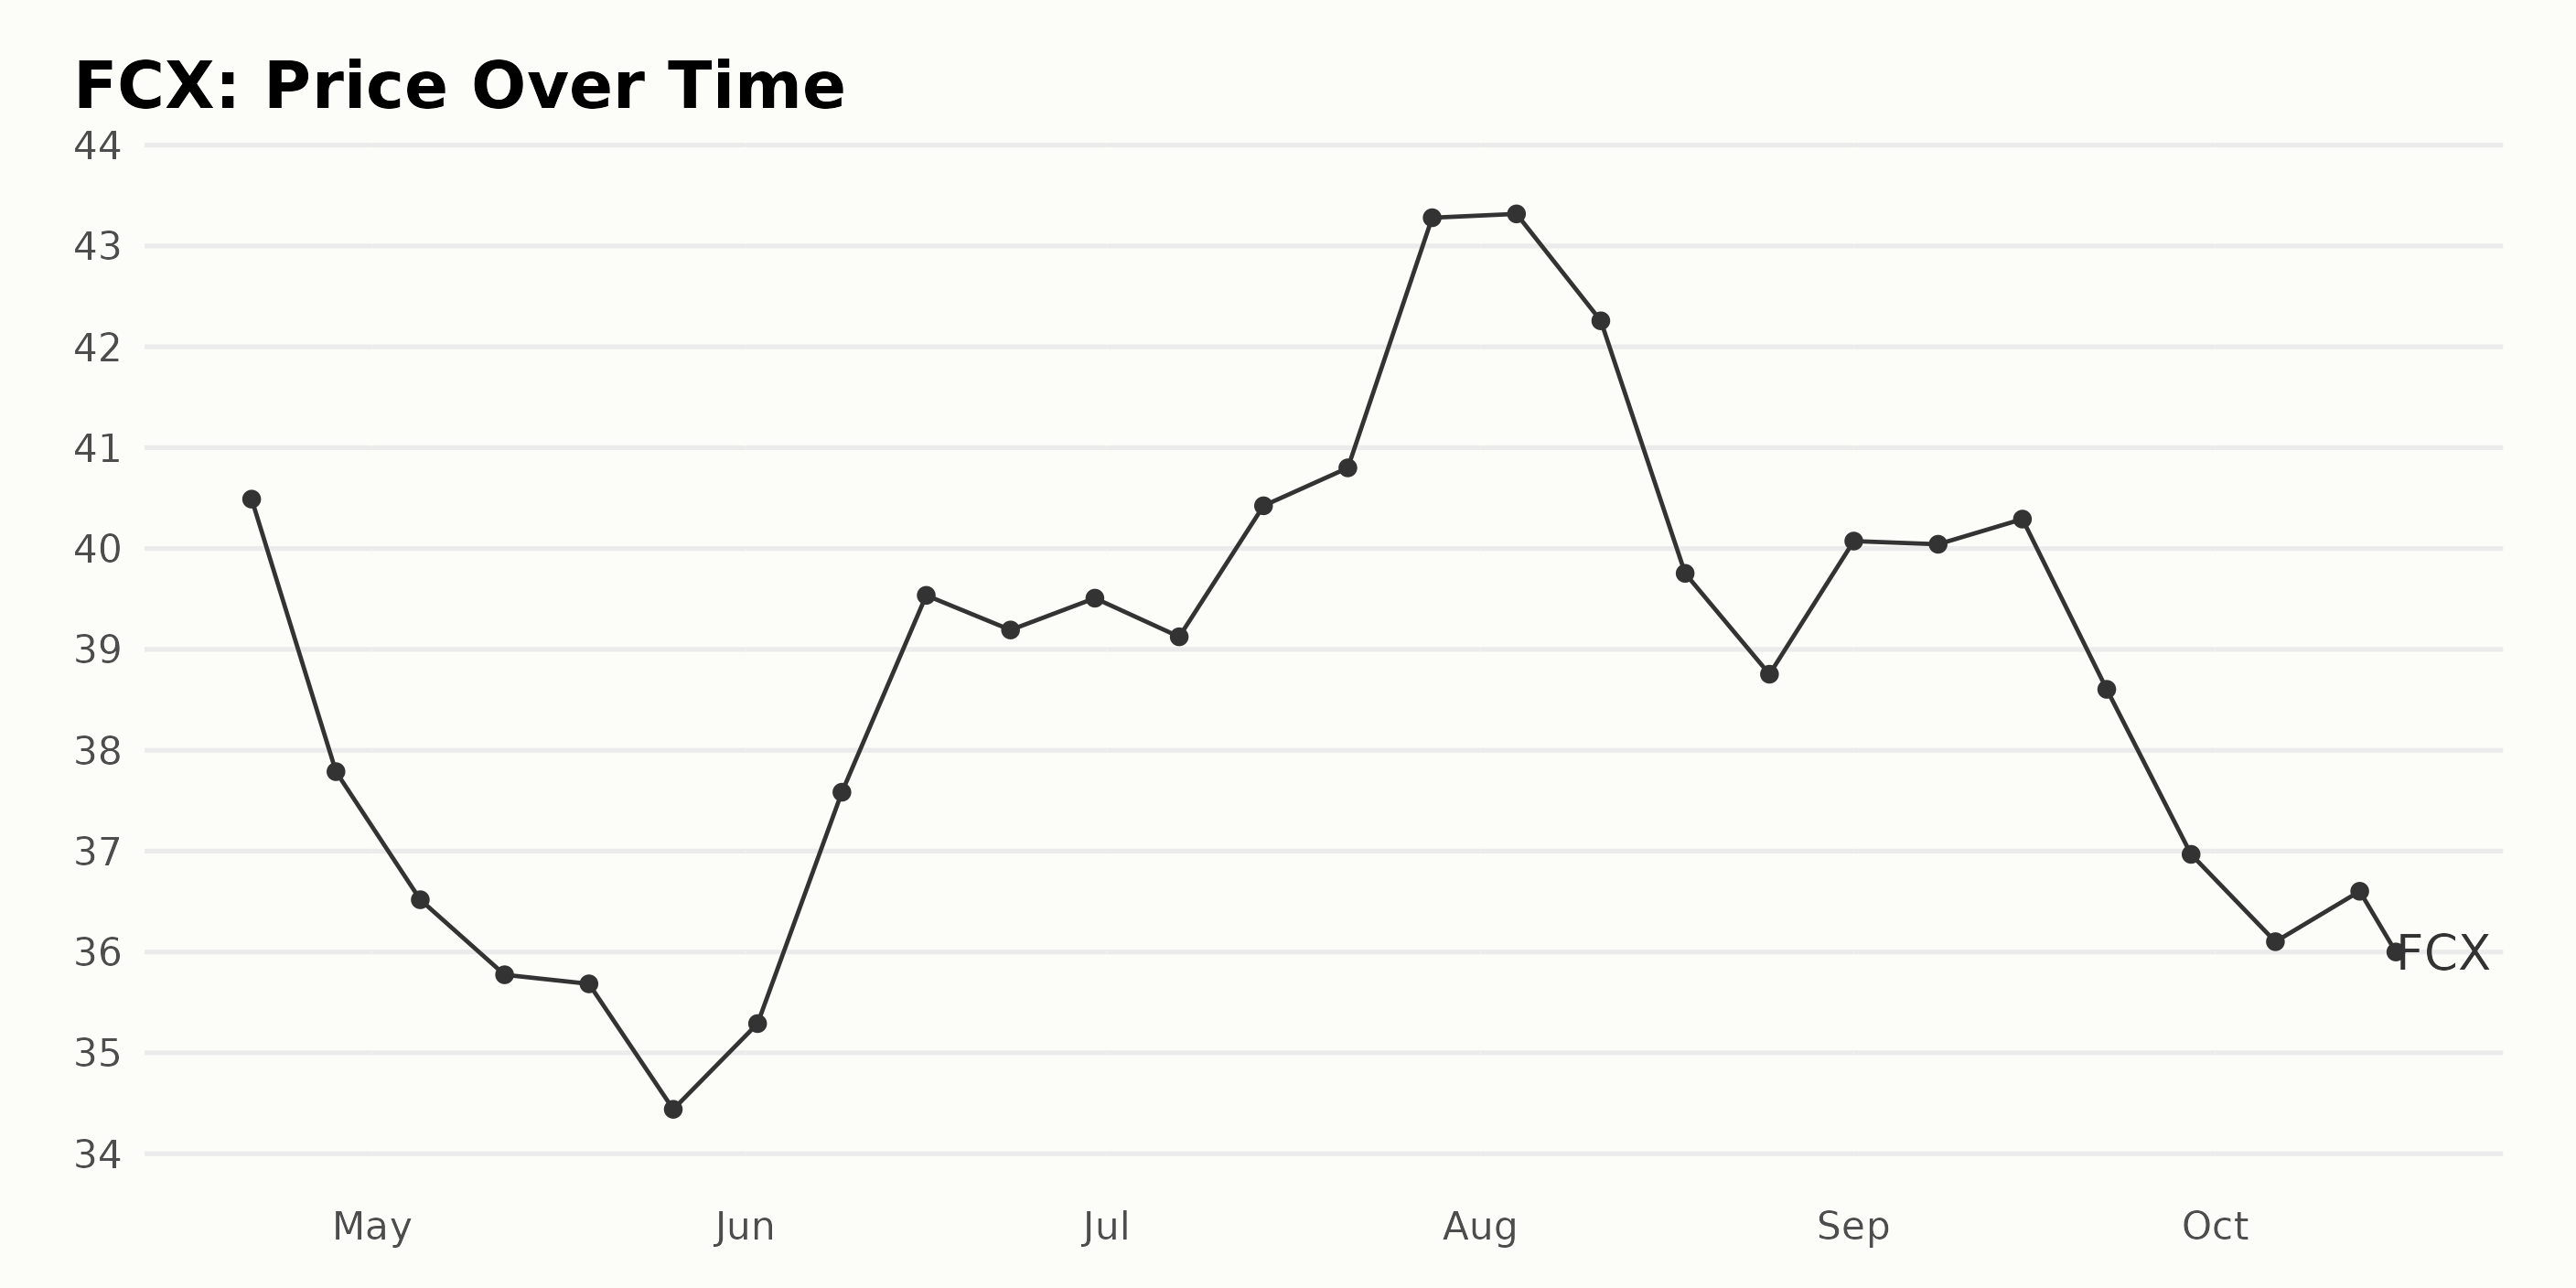
Analyzing Freeport-McMoRan's Stock Volatility: A Six-month Overview from April to October 2023
Based on the provided data, the share price of FCX indicates a mixed growth pattern with alternating periods of increase and decrease over from April 2023 to October 2023. Here are key points:
- FCX saw a gradual decline in share price from $40.49 on April 21, 2023, to $34.44 by May 26, 2023.
- This trend reversed in June 2023, with the share price increasing gradually from $35.29 on June 2, 2023, to $39.508 by the end of June 2023.
- In July 2023, the share price experienced a minor fluctuation before ending at a high by July 28 at $43.28.
- The price peaked on August 4, 2023, at $43.32 but followed a downward trend, dropping to $38.75 by the end of August.
- In early September 2023, the share price saw a minor recovery, peaking at $40.29 by September 15 but then falling again to approximately $36 by the end of the month. The stock price remained around this value throughout October 2023.
While there's no strictly upward or downward trend across the entire period, notable peaks are seen in April and August 2023 and smaller fluctuations around these peaks. The price variations suggest a level of volatility in the stock’s performance during this period. Here is a chart of FCX's price over the past 180 days.
Evaluating Freeport-McMoRan's Performance through Quality, Growth, and Sentiment Ratings
The POWR Ratings grade of FCX, which belongs to the Industrial - Metals category of stocks, indicates a fluctuating performance throughout the covered period. Here's how the POWR grade has changed:
- For the week of April 22, 2023, FCX held a POWR grade of C (Neutral), ranking #16 out of 31 in its category.
- They elevated their POWR grade to B (Buy) for the weeks from April 29, 2023, to May 27, 2023, improving their rank from #13 to as high as #12.
- The subsequent weeks up to June 3, 2023, saw them maintain their B (Buy) grade but fall slightly to #15.
- From June 10, 2023, their POWR grade dropped back down to C (Neutral) and stayed at that level till the week of October 14, 2023. The rank during this period mostly ranged between #17 and #15, with some weeks reaching as high as the #14 and #12 positions.
Based on the most recent data available from October 17, 2023, FCX stands at a B (Buy) POWR Grade, placing it at #11 rank within the Industrial - Metals category.
Upon analysis of FCX's POWR Ratings, the three most noteworthy dimensions are Quality, Growth, and Sentiment.
Quality: The Quality dimension persistently had the highest ratings over the specified period, reflected in the overall high scores recorded. This dimension started with a notable high score of 82 in April 2023 and climaxed at an impressive score of 85 by June 2023. Thereafter, the score moderately fluctuated but remained at a relatively high level of about 79 by October 2023.
Growth: The Growth rating exhibited a conspicuous rising trend from April to September 2023. It started from a rather modest level of 33 in April 2023, increased to 47 by May and continued on an ascending trajectory to attain a peak value of 68 by August and September 2023. By October, it marginally dropped to 67, still retaining a rather high level.
Sentiment: Sentiment ratings bore a mixed trend, oscillating up and down over the observed period. Starting from a reasonable score of 65 in April 2023, it dropped severely to 24 by June, recovered to 50 by May and October, before dropping again to 19 in July 2023.

How does Freeport-McMoRan Inc. (FCX) Stack Up Against its Peers?
Other stocks in the Industrial - Metals sector that may be worth considering are Rio Tinto Group (RIO), BHP Group Limited (BHP), and Anglo American plc (NGLOY) - they have better POWR Ratings. Click here to explore more stocks in the Industrial - Metals sector.
What To Do Next?
43 year investment veteran, Steve Reitmeister, has just released his 2024 market outlook along with trading plan and top 11 picks for the year ahead.
FCX shares were trading at $36.65 per share on Tuesday afternoon, up $0.80 (+2.23%). Year-to-date, FCX has declined -2.12%, versus a 15.67% rise in the benchmark S&P 500 index during the same period.
About the Author: Anushka Dutta

Anushka is an analyst whose interest in understanding the impact of broader economic changes on financial markets motivated her to pursue a career in investment research.
The post Freeport-McMoRan (FCX) Earnings Analysis: A Solid Buy or Hold? appeared first on StockNews.com