BlackRock, Inc. (BLK) surpassed profit expectations in the third quarter, although it underwent a notable decline in net inflows, which dove to $2.57 billion from $16.9 billion the previous year. This reduction reveals a massive outflow of $49 billion from its lower-fee institutional index equity strategies, including a significant deduction of $19 billion from one international client.
In contrast, BlackRock experienced an approximately 5% increase in revenue in comparison to last year, rising to $4.52 billion. Factors contributing to this growth include organic expansion and the impact of market changes during the past year on average AUM, in addition to heightened technology services revenue.
At the close of the third quarter, BlackRock’s assets under management (AUM) amounted to $9.10 trillion, marking an increase from the $7.96 trillion reported a year prior yet indicating a decline from the second quarter's $9.4 trillion.
The firm's results "underscore continued pressure on industry organic growth that may last longer than currently reflected in investors’ expectations amid higher-for-longer short-term rates," analysts at Goldman Sachs wrote. Their forecast posits muted growth for the company’s near-term organic base fee.
Simultaneously, BlackRock has been proactively involved in acquisition discussions in anticipation that substantial mergers could bolster growth through periods of market instability.
Additionally, for the quarter ended in December 2023, Wall Street analysts predict a 5.8% year-on-year increase in BLK's revenues to reach $4.59 billion. Nevertheless, EPS for the same period is projected to retreat by 2.1% compared to last year, to $8.74.
Considering these short-term uncertainties, it may be prudent for prospective investors to bide their time for a more opportune window to invest in BLK. A detailed examination of key fundamental performance indicators could provide valuable insights in this context.
Deciphering Fluctuations in BlackRock Inc.'s Net Income, Revenue, and Analyst Price Target from 2021 to 2024
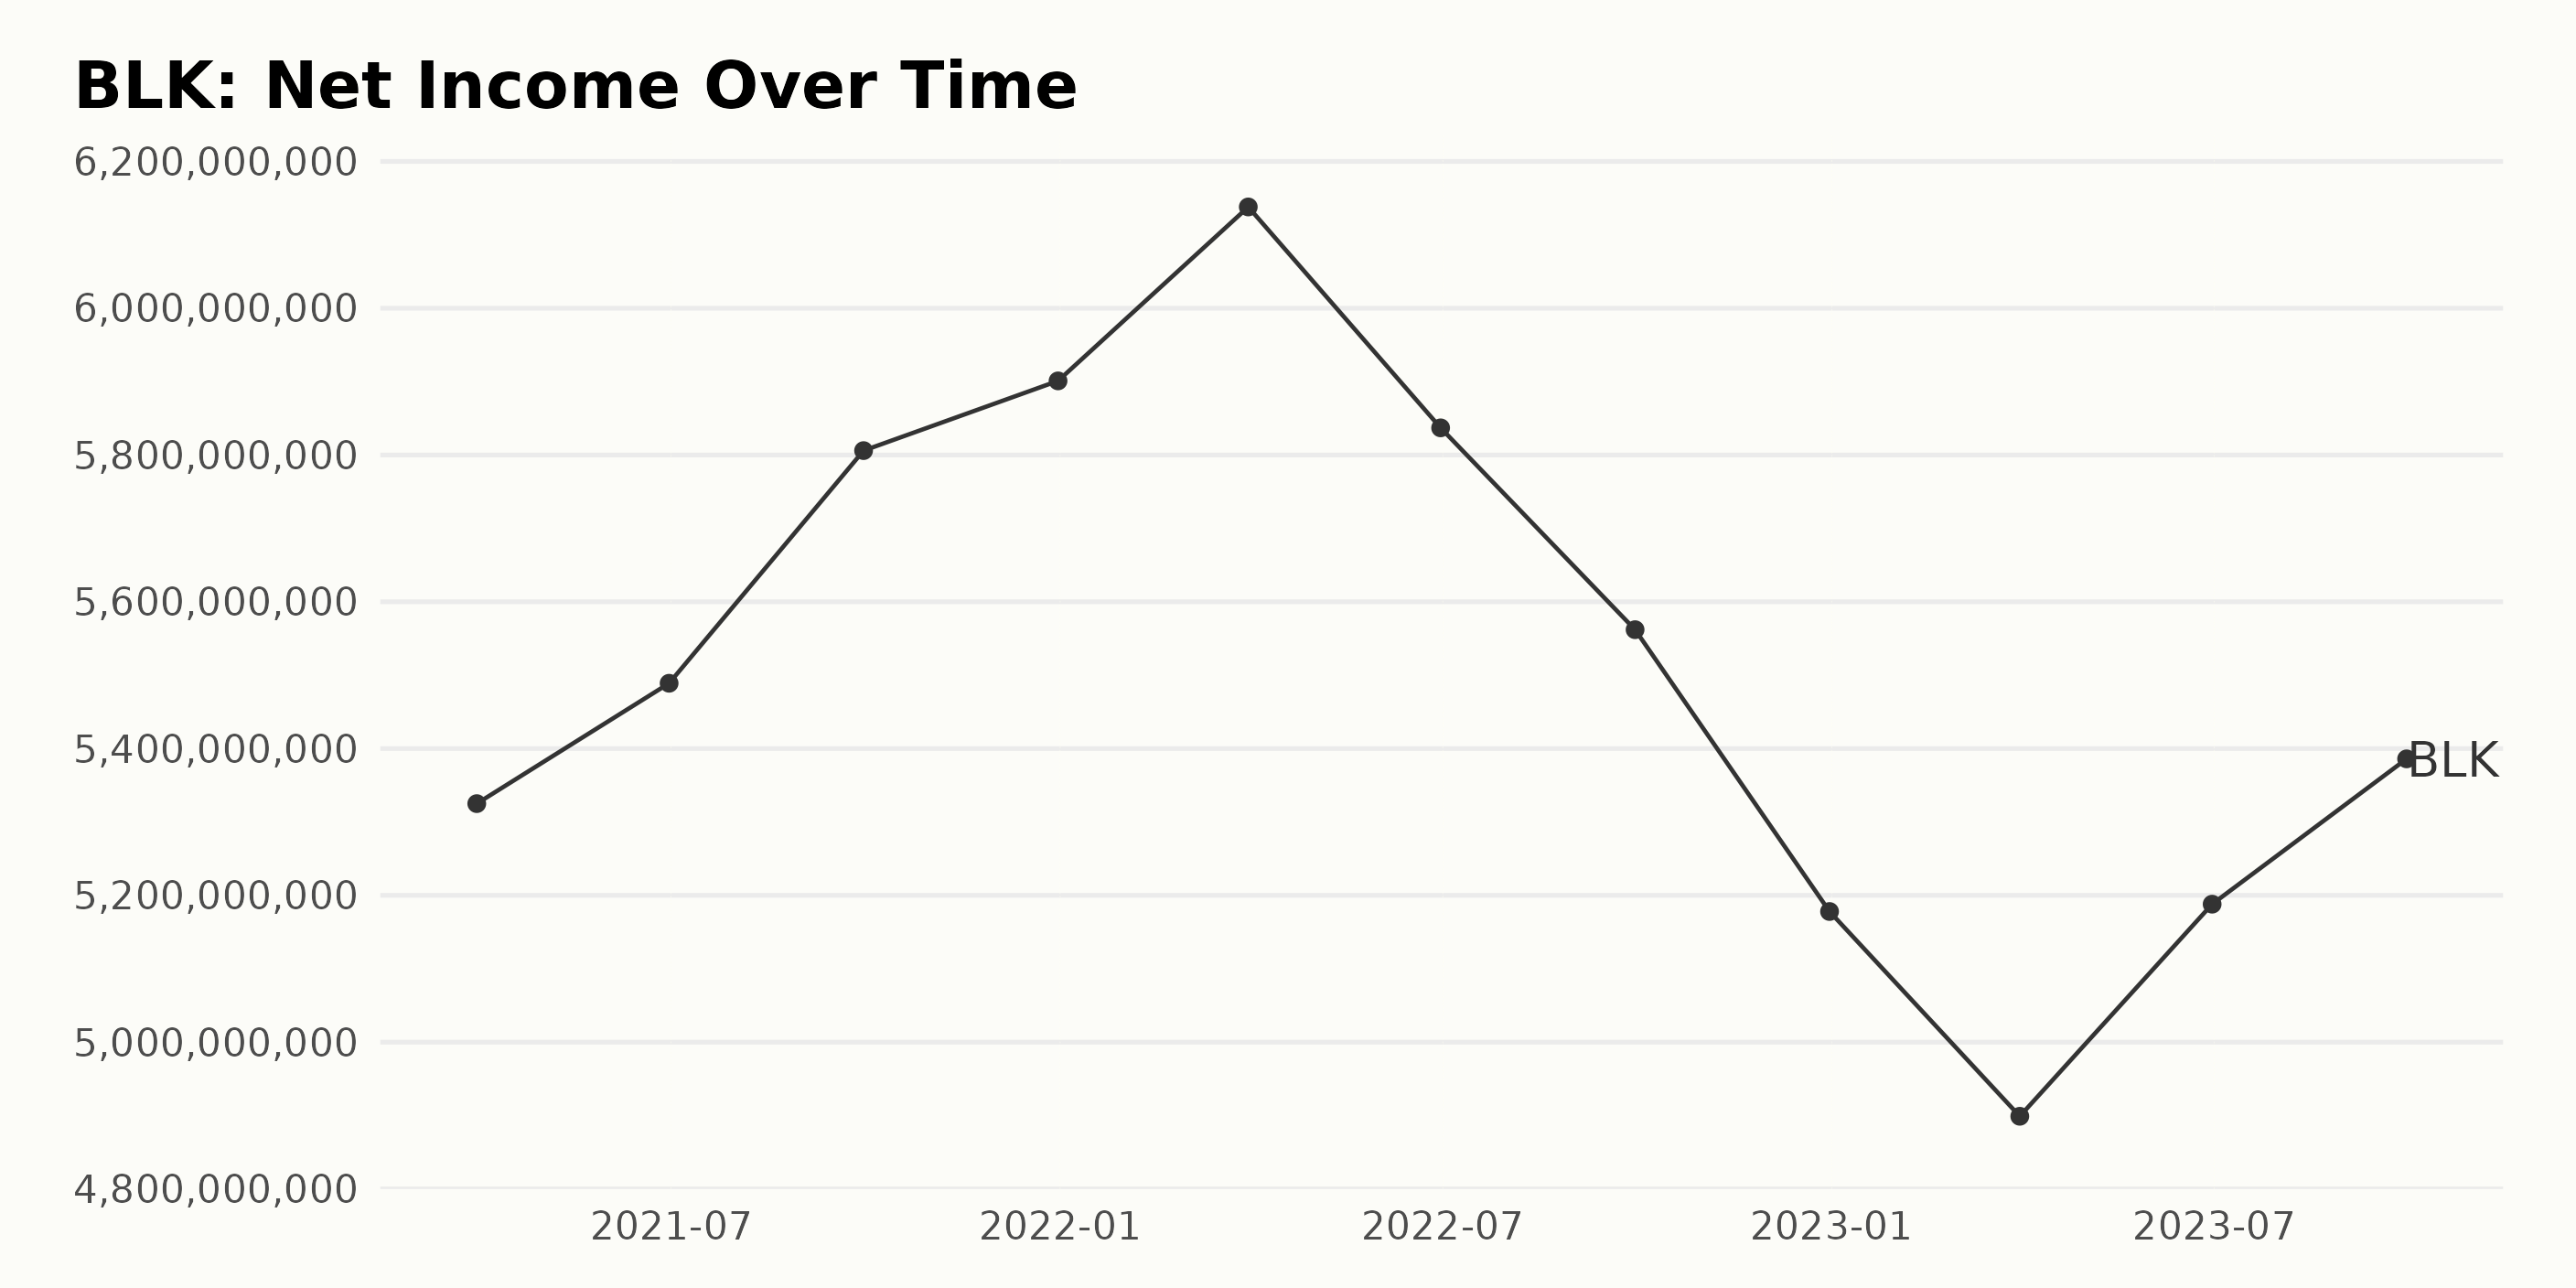
The trend in BLK’s trailing-12-month Net Income over the period from March 2021 to September 2023 shows a noticeable fluctuation, with an overall growth rate decrease.
- The net income of BLK started at $5.33 billion in March 2021 and increased steadily until it peaked at $6.14 billion in March 2022.
- However, post March 2022, there was a significant decline as the net income dropped to $5.18 billion in June 2023, after hitting a low of $4.90 billion in March, coming down from its peak of $6.14 billion.
- By the end of the series in September 2023, the net income had managed to recover slightly to $5.39 billion but remained lower than its peak value.
The overall growth rate, calculated from the initial value in March 2021 to the last available in September 2023, shows a decrease of about 3%. This indicates that although there have been periods of increase in between, the overall trend for this period has been a slight downward one. A steady increase in the first year followed by a tumultuous second year that ended in a net decrease demonstrates the volatile nature of the net income of BlackRock Inc. during this period. The lower recent numbers show signs of struggle in maintaining the high revenues as seen in early 2022.
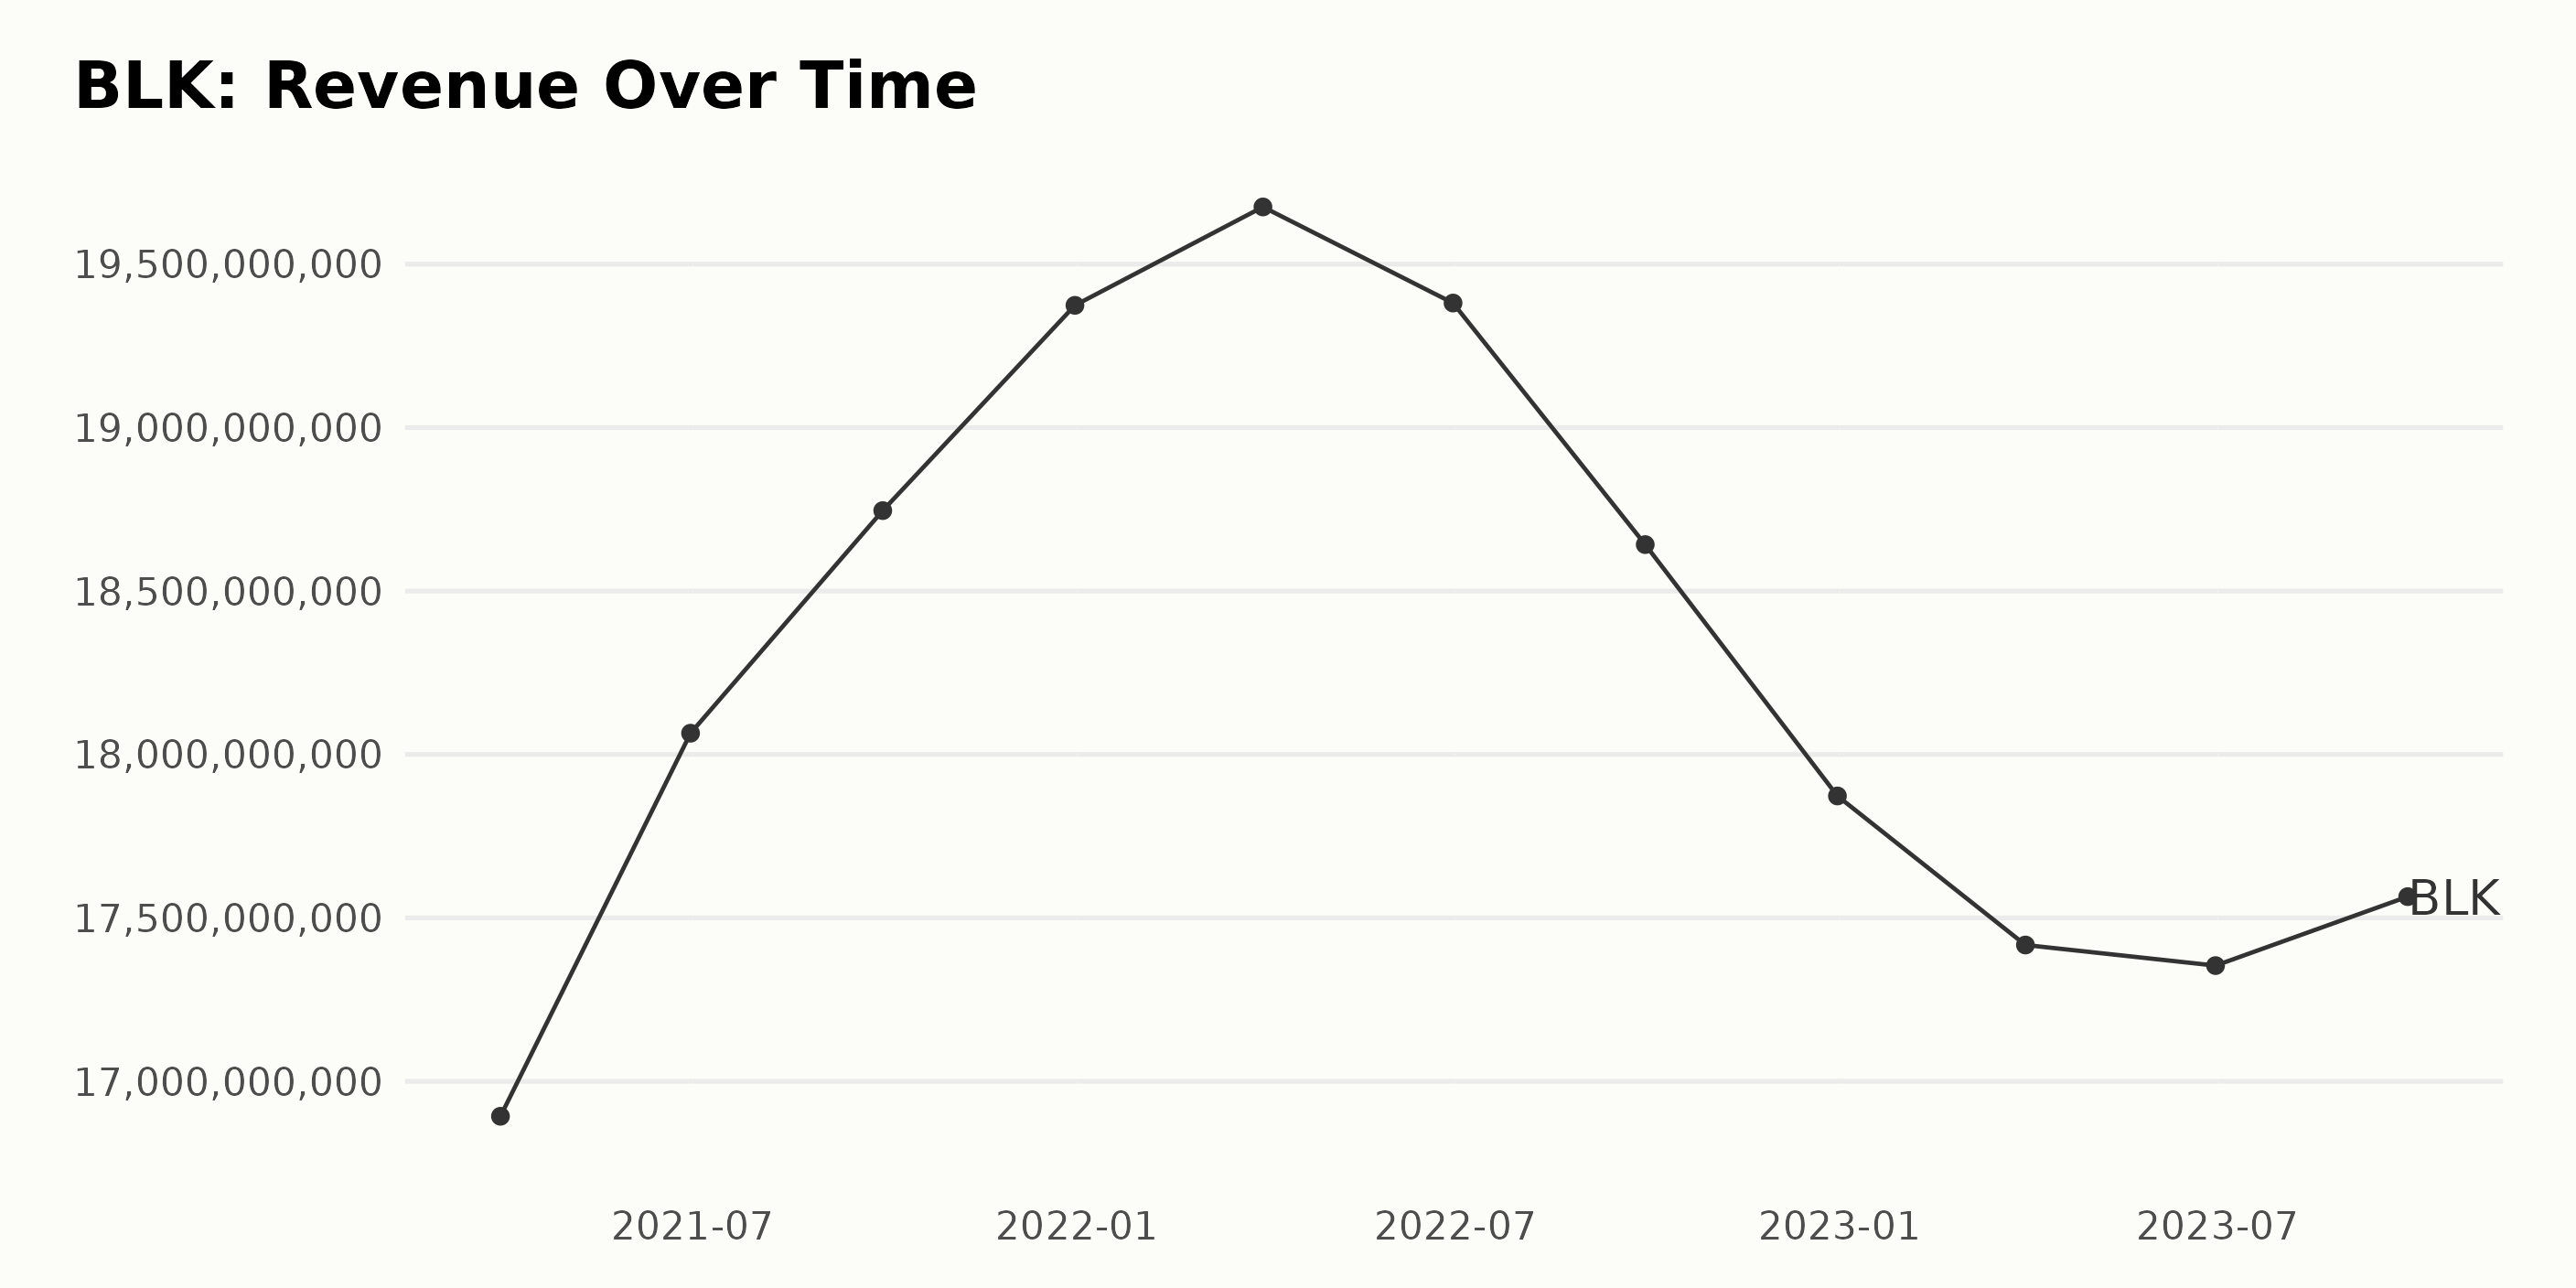
The trailing-12-month revenue trend of BLK reveals a roller-coaster ride over the period ranging from March 2021 to September 2023.
March 2021: The revenue started off at $16.89 billion.
2021 Growth: Throughout the rest of 2021, the revenue showed an upward trend, peaking at $19.37 billion by the end of December.
2022 Decline: However, 2022 saw a downswing in numbers for BlackRock. By March, it had a minor increase to $19.68 billion, but that was followed by consecutive decreases till the year-end, recording its lowest at $17.87 billion in December.
2023 Slight Recovery: In 2023, there was a slight recovery as the figures climbed from $17.42 billion in March to $17.56 billion by September. As per the available dataset, it's been noted that the revenue has declined by approximately 13.9% from its peak of $19.37 billion in December 2021 reaching to $17.56 billion by September 2023.
Emphasizing the most recent values, there was a minimal growth of 0.6% between June 2023 ($17.35 billion) and September 2023 ($17.56 billion). This data underlines some volatility in the revenue trends of BlackRock Inc., with a clear high-point in late 2021, followed by a considerable decrease throughout 2022 and a faint recovery in 2023.
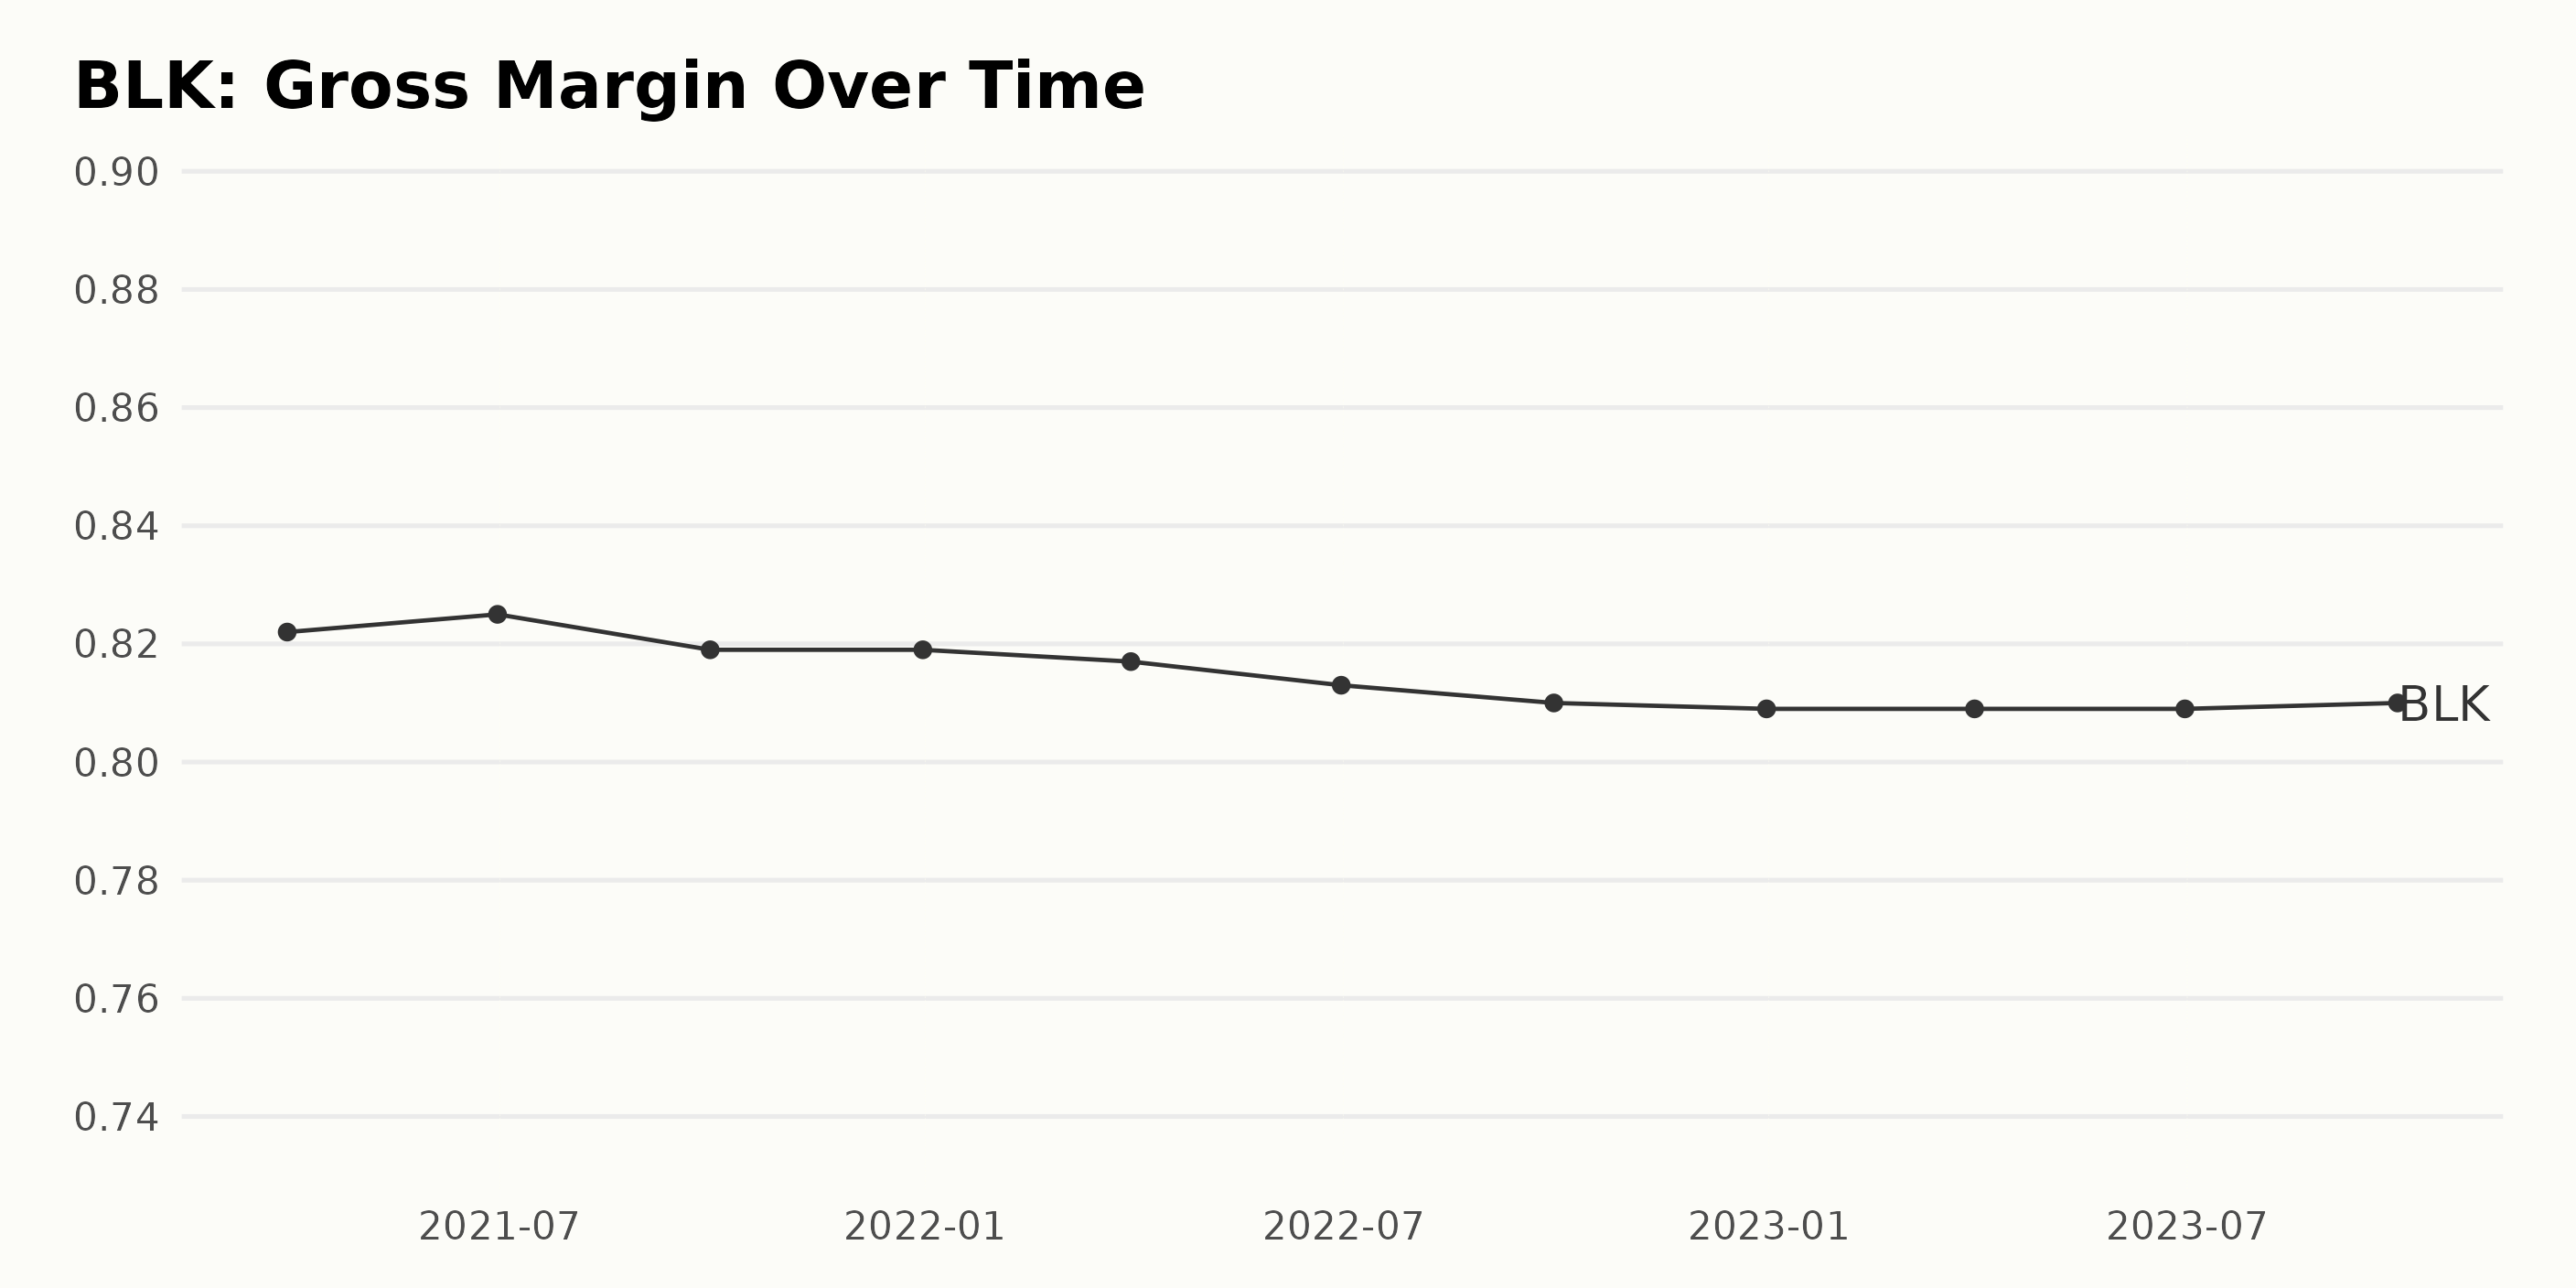
In the analysis of BLK’s Gross Margin from March 2021 to September 2023, the following are worthy of note:
- The Gross Margin ranged from 82.2% in March 2021 to 81.0% in September 2023.
- A generally declining trend is observed throughout the given period. This lack of consistent growth presents as a gradual reduction of Gross Margin percentage.
- In the first half of 2021, the Gross Margin slightly climbed from 82.2% in March to 82.5% in June, after which it began to slowly decline.
- There was a small dip between June 2021 and September 2021, slipping from 82.5% to 81.9%. This figure remained constant through December 2021.
- Starting 2022, the Gross Margin mirrored the previous year’s pattern as it mildly slid throughout the year, resting at 80.9% by December.
- This pattern continued into 2023, with the Gross Margin starting from 80.9% in March, maintaining the same figure in June, before witnessing a minor increment to 81.0% in September.
- Despite these fluctuations, there's a general decrease of about 1.2% over the recorded period. It's critical to stress the importance of recent data within this trend. The Gross Margin seemed relatively steady since June 2022 at about 80.9%, with only a minute bump of 0.1% perceived nearly a year later, in September 2023, reaching 81.0%.
This recent semblance of stability contrasts the broader downward trend from the past two years. Therefore, current indications could imply a possible end to the previous downward trend. However, only time will confirm if this stabilizing Gross Margin is sustainable for BlackRock Inc.
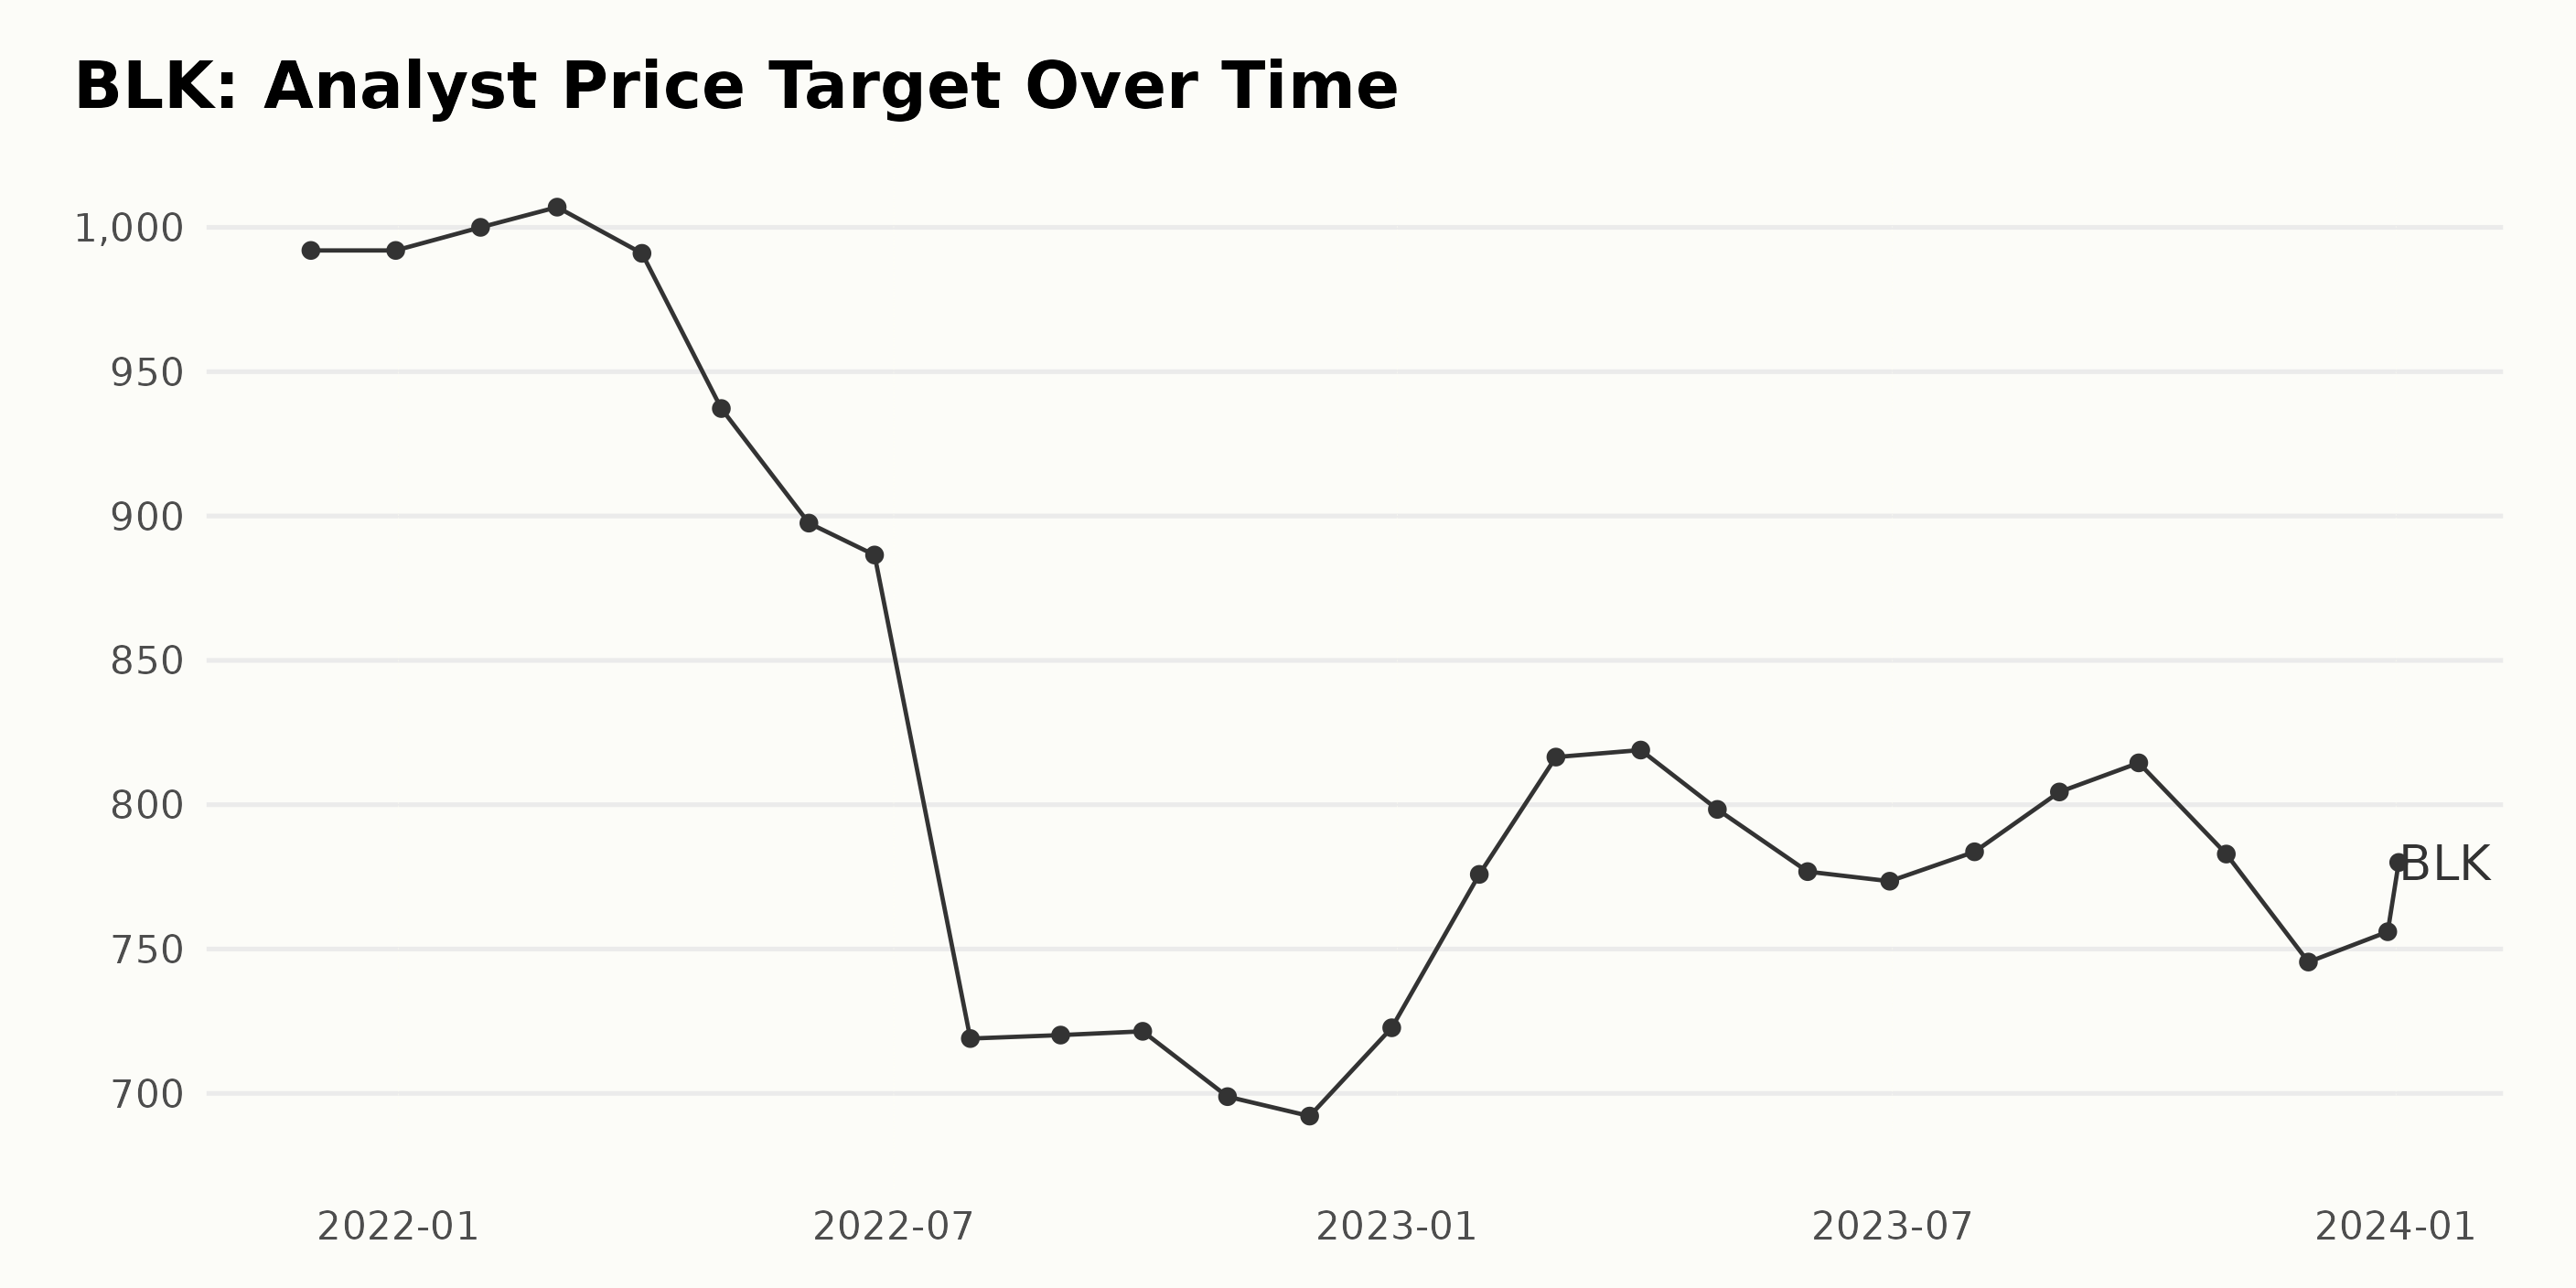
The data series shows the trend and fluctuations in the Analyst Price Target for BLK from November 2021 to January 2024.
- Starting at $992 in November 2021, the price target stayed stable until January 2022, before increasing to its series high of $1,007 in February 2022.
- A downward trend was then observed, dropping sharply to a series low of $692.14 in November 2022.
- From December 2022 onwards, the price target generally started an upward trend, reaching $818.93 by March 2023.
- This was followed by a period of slight volatility between April and October 2023, with the price target dropping to a low of $776.82 in May and peaking again at $814.5 in September.
- Subsequently, a decline occurred from October to November 2023, as the price target dropped from $782.91 to $745.5.
- In December 2023, the price rose to $756 and continued to grow up to $780 in January 2024.
Overall, from November 2021 to January 2024, there is a decrease of roughly 21% in the Analyst Price Target of BLK. Recognizing the potential for future changes, the more recent data entries, specifically those from November 2023 to January 2024, show a gradual increase, indicating a potentially positive outlook for the upcoming period.
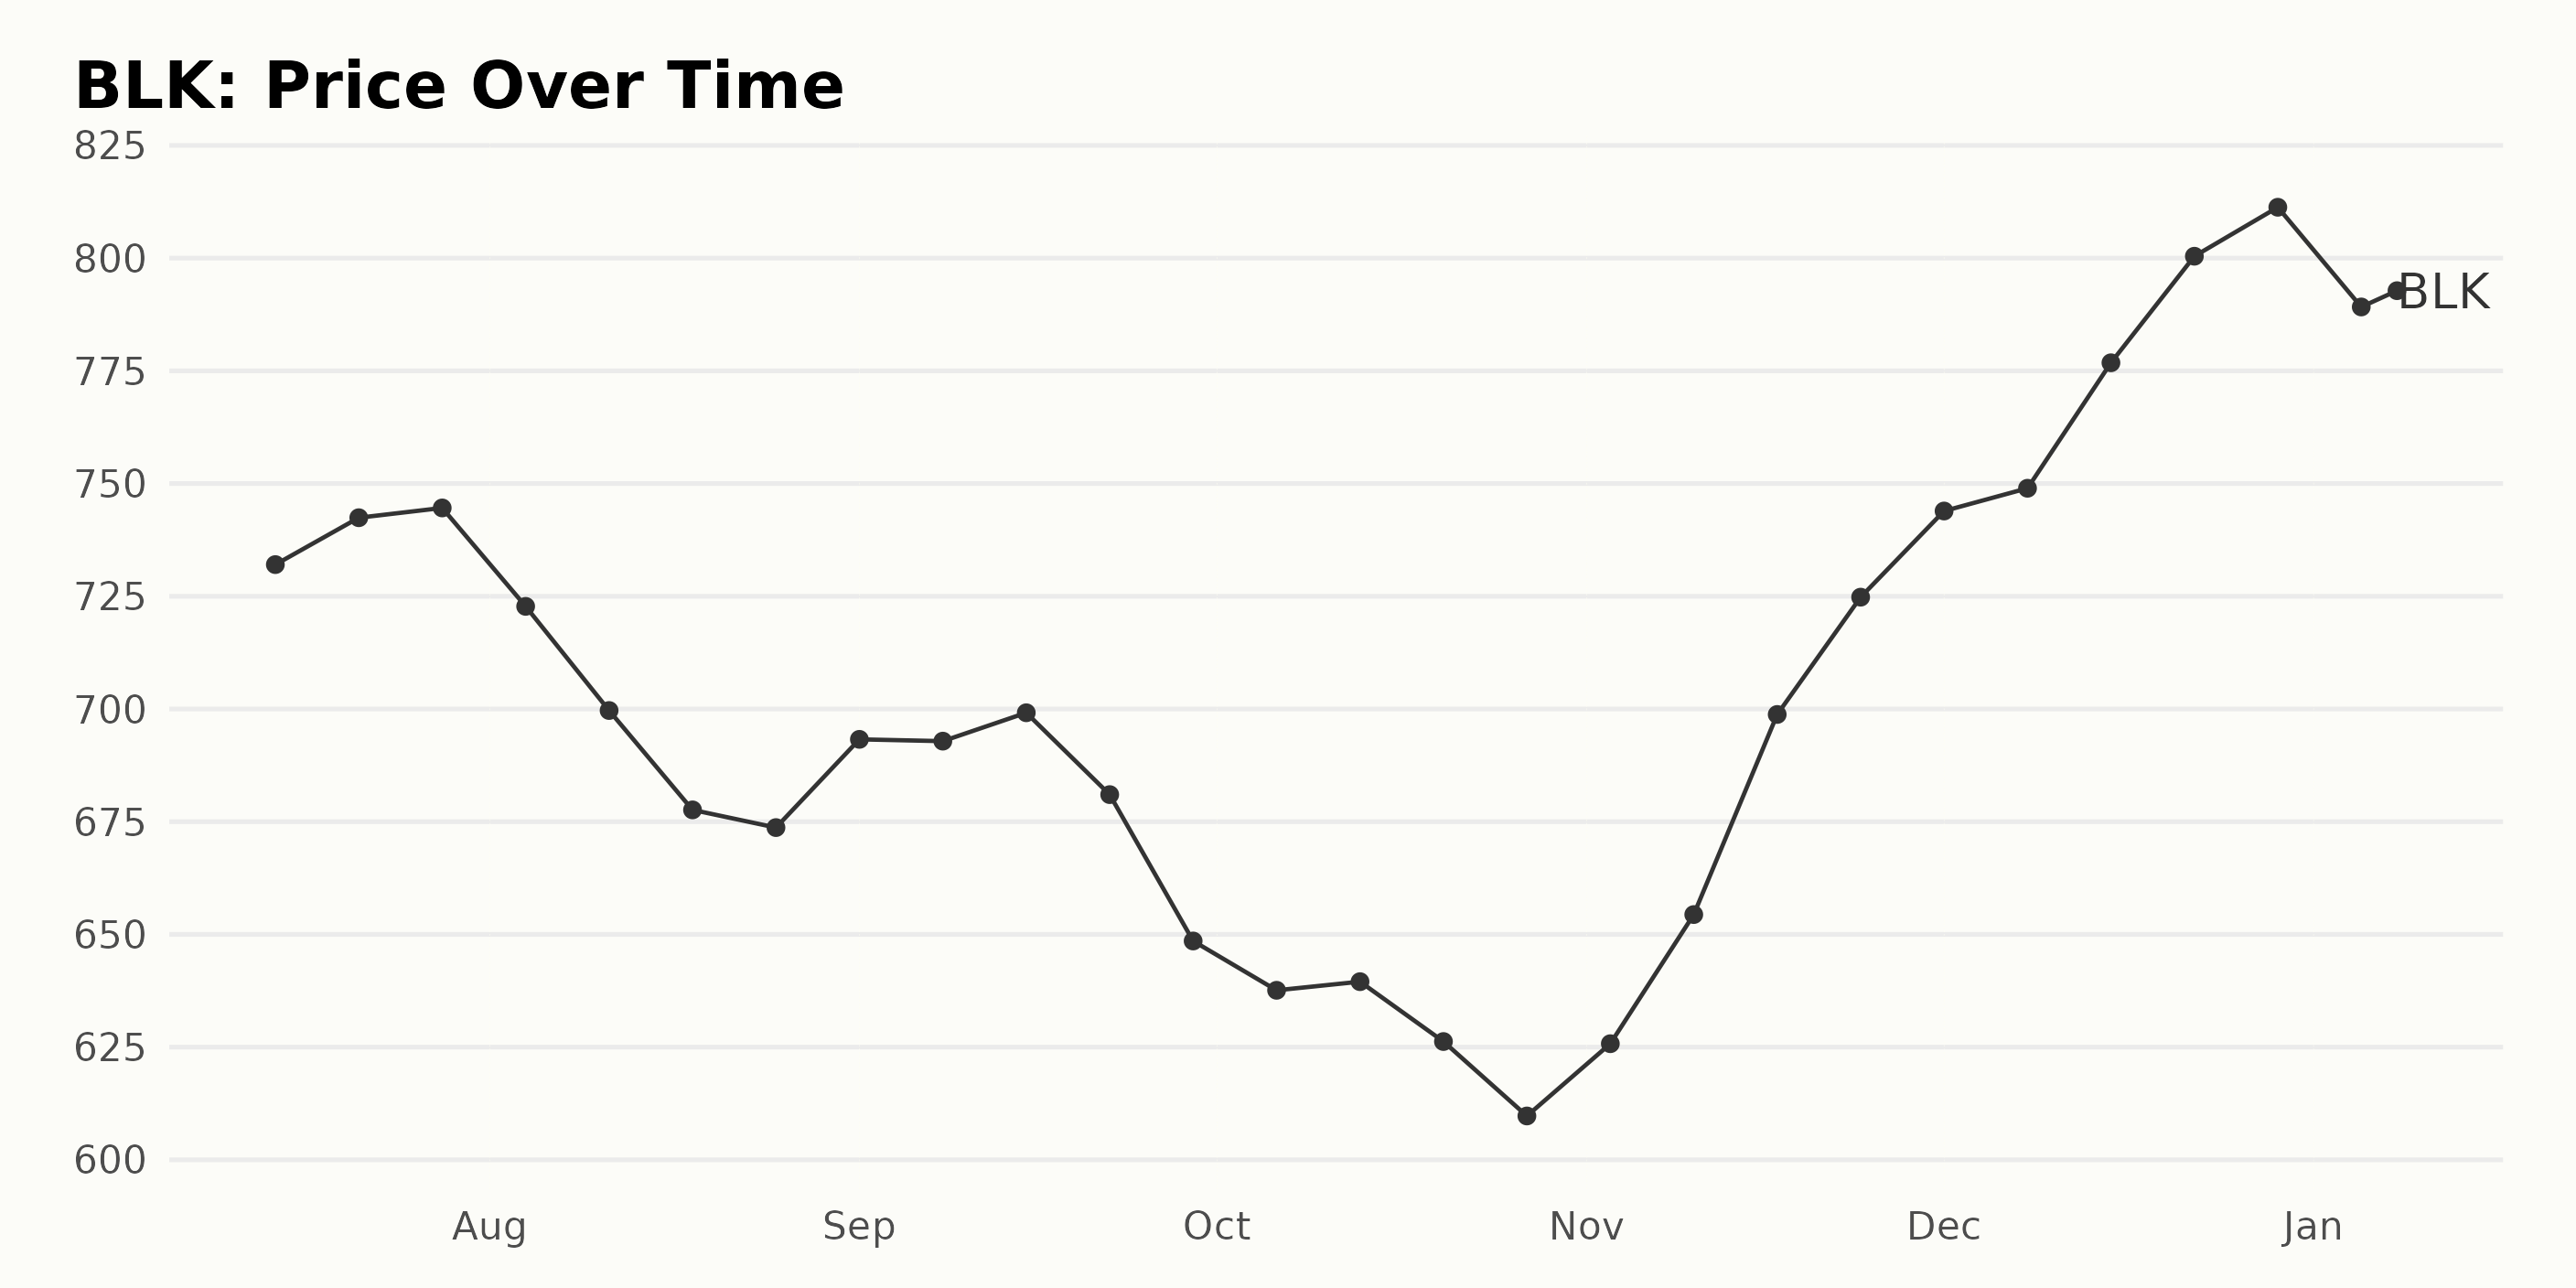
Analyzing BlackRock Inc.'s Share Price Volatility from July 2023 to January 2024
The data clearly shows a changing trend in the share price of BlackRock Inc. (BLK) throughout the period from July 2023 to January 2024.
July to August 2023: In early July, we see the share price growing from $732.03 on July 14 to a peak of $744.59 by July 28. However, this upward trend reverses in August, and the price experiences a decline, reaching a low of $673.69 by August 25.
September to October 2023: In September, the price starts an upwards correction, peaking at $699.16 by mid-September. This is followed by a decline, dropping to $648.54 by the end of September. The downtrend continues into October 2023, leveling off around the mid $630s by end of October.
November to December 2023: An upward trend initiates in November, with the price increasing significantly from $625.76 to $698.78 in mid-November. The upward movement accelerates in December, culminating at a high of $811.29 by the end of the year.
January 2024: In early January 2024, the share price slightly drops to $789.17 on January 5, then mildly recovers to $792.78 by January 8.
The overall growth rate for this period is approximate and based purely on opening and closing values. The initial value on July 14, 2023 was $732.03, and the final recorded value was $792.78 on January 8, 2024. The average rate of growth stands at a positive 8.3%, indicating an increase in the value of BLK over this time span. However, it is clear from the data that there is volatility in this growth, with periods of both acceleration and deceleration. The share price peaked in December 2023, after which there was a minor decrease in January 2024. Here is a chart of BLK's price over the past 180 days.
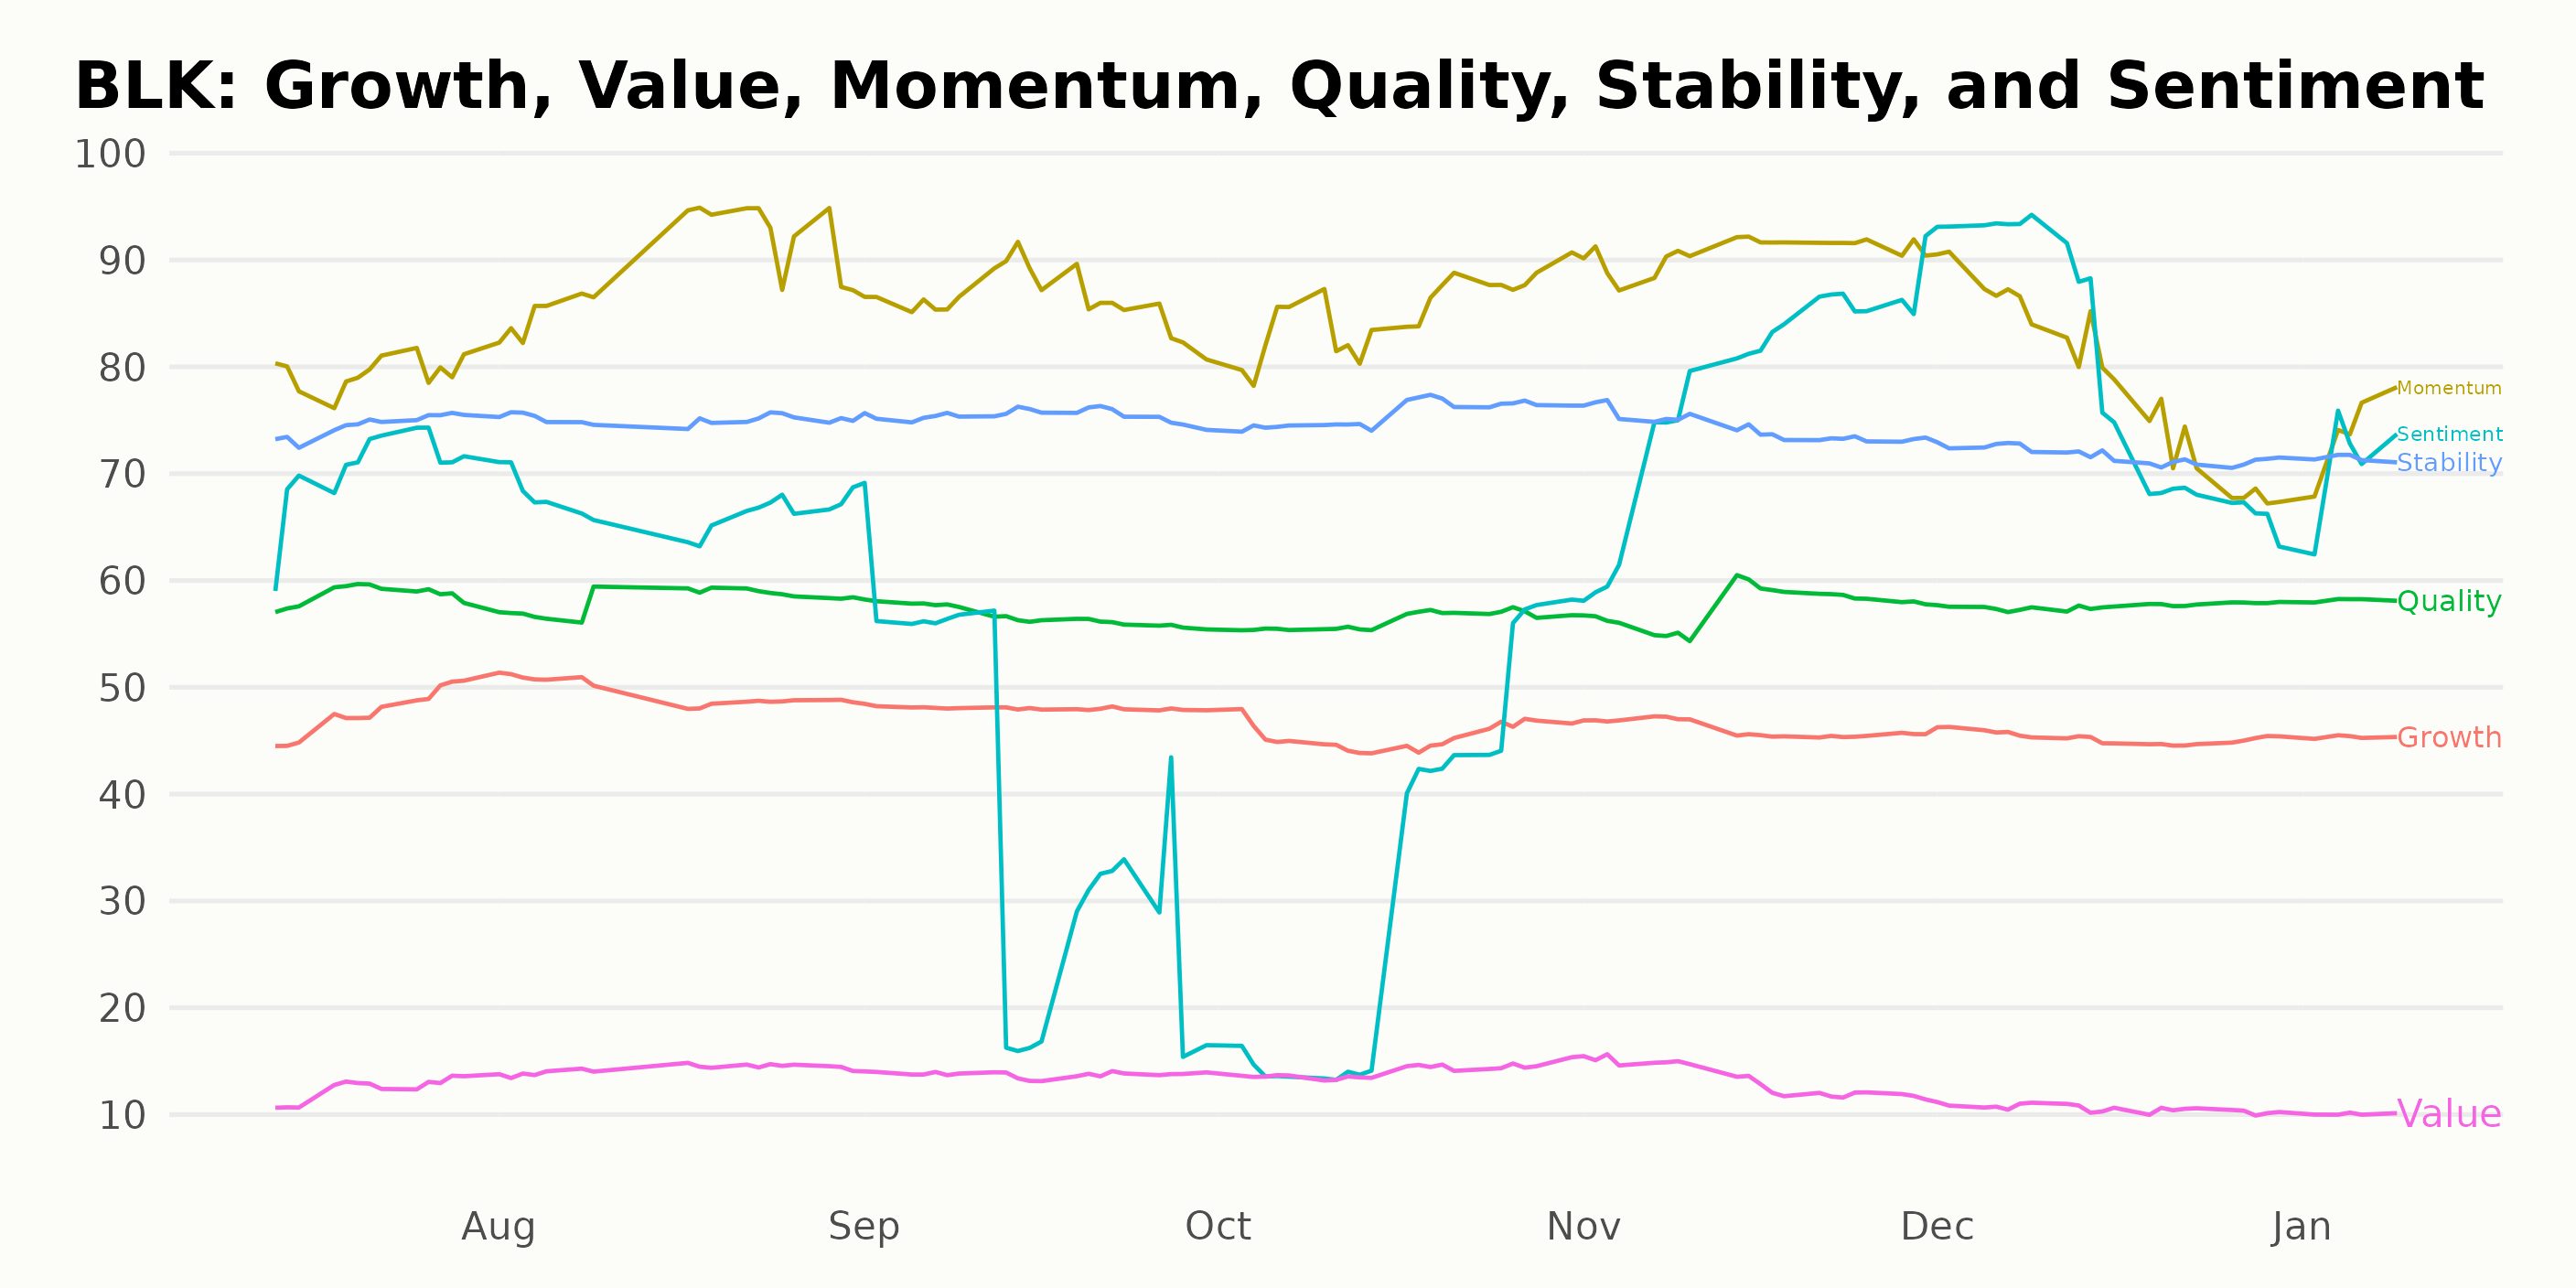
Examining BlackRock's High-Performing POWR Ratings: Momentum, Stability and Sentiment
BLK has an overall C rating, translating to a Neutral in our POWR Ratings system. It is ranked #30 out of the 50 stocks in the Asset Management category.
In examining the POWR Ratings for BLK there are three dimensions that stand out due to their high ratings: Momentum, Stability, and Sentiment.
Momentum emerged as the dimension with the highest ratings across several months. Starting at a value of 79 in July 2023, it displayed a steady upward trend, reaching a peak value of 91 in November 2023. Despite slight fluctuations in subsequent months, the Momentum rating remained consistently high, closing at a respectable score of 74 by January 9, 2024.
Stability maintained a strong and steady presence in the ratings. It fluctuated slightly over time, but mostly hovered around the 75 mark. From July to September 2023, the Stability rating remained at a solid 75. There was a slight uptick to 76 in October 2023, but this then dipped back down to 74 in November and slipped to 71 by January 2024.
The Sentiment dimension exhibited the most variability, albeit on an overall solid level. The value initially stood at 71 in July 2023, dropped to 38 in September 2023, before rocketing up to 78 in November 2023. Although it experienced another slight fall, dropping to 71 by January 2024, it still boasted one of the higher average ratings.
Based on these observations, Momentum and Stability were the most consistently high performers over the specified period, with Sentiment displaying impressive resilience and recovery. Overall, these three dimensions played the most significant roles in BLK’s POWR ratings during this timeframe.
How does BlackRock Inc. (BLK) Stack Up Against its Peers?
Other stocks in the Asset Management sector that may be worth considering are Silvercrest Asset Management Group Inc. (SAMG), Westwood Holdings Group Inc (WHG), and Victory Capital Holdings Inc. (VCTR) -- they have better POWR Ratings.
What To Do Next?
Discover 10 widely held stocks that our proprietary model shows have tremendous downside potential. Please make sure none of these “death trap” stocks are lurking in your portfolio:
BLK shares were trading at $793.70 per share on Tuesday afternoon, down $3.49 (-0.44%). Year-to-date, BLK has declined -2.23%, versus a -0.15% rise in the benchmark S&P 500 index during the same period.
About the Author: Subhasree Kar

Subhasree’s keen interest in financial instruments led her to pursue a career as an investment analyst. After earning a Master’s degree in Economics, she gained knowledge of equity research and portfolio management at Finlatics.
The post BlackRock (BLK) Earnings Spotlight and Gameplan appeared first on StockNews.com